The given pie chart shows the quantity wise sales distribution of five products (A, B, C, D and E) of a company in 2016.
दिया गया पाई चार्ट 2016 में एक कंपनी के पाँच उत्पादों ( A, B, C, D और E ) की मात्रा वार बिक्री का वितरण दर्शाता है |
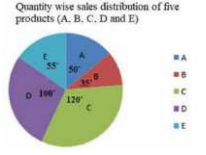 If 320 units of product A were sold by the company, then how many units of products B and E together were sold by the company?
यदि कंपनी के द्वारा वस्तु A की 320 इकाइयाँ बेची गयीं , तो कंपनी के द्वारा बेची गयी वस्तु B और E की कुल इकाइयों की संख्या ज्ञात करें |
567
576
512
640
Step by step video & image solution for The given pie chart shows the quantity wise sales distribution of five products (A, B, C, D and E) of a company in 2016. दिया गया पाई चार्ट 2016 में एक कंपनी के पाँच उत्पादों ( A, B, C, D और E ) की मात्रा वार बिक्री का वितरण दर्शाता है | If 320 units of product A were sold by the company, then how many units of products B and E together were sold by the company? यदि कंपनी के द्वारा वस्तु A की 320 इकाइयाँ बेची गयीं , तो कंपनी के द्वारा बेची गयी वस्तु B और E की कुल इकाइयों की संख्या ज्ञात करें | by Maths experts to help you in doubts & scoring excellent marks in Class 14 exams.
Updated on:21/07/2023Topper's Solved these Questions
Similar Questions
The given pie chart shows the quantity wise sales distribution of five products (A, B, C, D and E) of a company in 2016.
दिया गया पाई चार्ट 2016 में एक कंपनी के पाँच उत्पादों ( A, B, C, D और E ) की मात्रा वार बिक्री का वितरण दर्शाता है |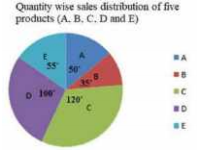 If 1500 units of product D were sold in 2016 and the total number of units sold by the company in
2017 was 18% more than that sold in 2016, then the total units sold by the company in 2017 is:
यदि 2016 में वस्तु D की 1500 इकाइयाँ बेचीं गयीं और 2017 में कंपनी द्वारा बेचीं गयी इकाइयों की कुल संख्या 2016 में बेचीं गयी इकाइयों की कुल संख्या से 18% अधिक थी, तो 2017 में कंपनी द्वारा बेची गयी कुल इकाइयों की संख्या है
View SolutionThe given pie chart shows the quantity wise sales distribution of five products (A, B, C, D and E) of a company in 2016.
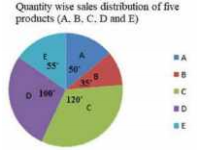 In 2016, if a total of 14616 units were sold, then the number of units of products D sold was:
View Solution
Knowledge Check
The given pie chart shows the quantity wise sales distribution of five products (A B C D E) of a company in 2016
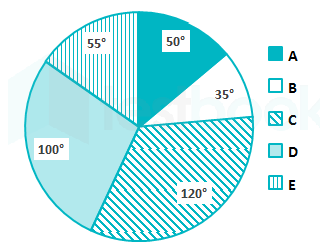
If 1500 units of products D were sold in 2016 and the total number of units sold by the company in 2017 was 18% more than that sold in 2016, then the total units sold by the company in 2017 is:A4263B4872C4060D4096
The given pie chart shows the quantity wise sales distribution of five products (A, B, C, D and E) of a company in 2016.
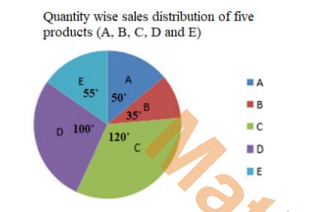 In 2016, if a total of 14616 units were sold, then the number of units of products D sold was:
View SolutionThe given pie chart shows the quantity wise sales distribution of five products (A, B, C. D and E) of a company in 2016.
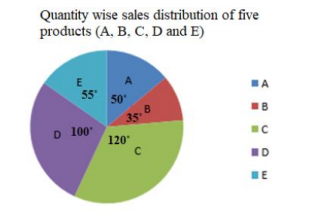 If 320 units of product A were sold by the company, then how many units of products B and E together were sold by the company”?
View SolutionThe given pie chart shows the quantity wise sales distribution of five products (A, B, C, D and E) of a company in 2016.
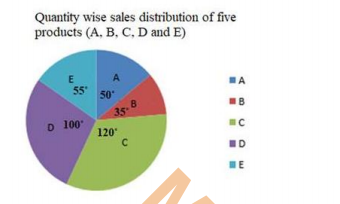 If 1500 units of product D were sold in 2016 and the total number of units sold by the company in 2017 was 18% more than that sold in 2016, then the total units sold by the company in 2017 is:
View SolutionThe given pie chart shows the quantity wise sales distribution of five products (A B C D E) of a company in 2016

If 1500 units of products D were sold in 2016 and the total number of units sold by the company in 2017 was 18% more than that sold in 2016, then the total units sold by the company in 2017 is:
View SolutionThe given bar graph shows the production and sale of mobile handsets of five different companies A, B, C, D, E, & F during the period of one month.
दंड आरेख विभिन्न कंपनियों A, B, C, D, E & F की एक माह में मोबाइल हैंडसेट के उत्पादन और बिक्री को दर्शाता है |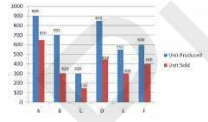
The units sold by the companies A, B and C, taken together, is approximately what percent of the total units produced by the companies A, B and C ? (to the nearest integer )
कंपनी A, B और C द्वारा कुल मिलाकर बिक्री की गई यूनिटें, कंपनी A, B और C द्वारा मिलाकर उत्पादित कुल यूनिटों का लगभग कितना प्रतिशत है (निकटतम पूर्णाक तक)?
View SolutionStudy the given graph and answer the question that follows.
दिए गए आरेख का अध्ययन करें और उन सवालों के जवाब दें जो अनुसरण करते हैं।
Break up for distribution ( degree wise) of the employees working in five departments (A, B, C, D and E) in a company
एक कंपनी के पाँच विभागों (A, B, C, D and E) में कार्य करने वाले कर्मचारियों का वितरण (डिग्री अनुसार):
The number of employees in department B is what percent of the total number of employees working in department D and E ?
विभाग B में कर्मचारियों की संख्या विभाग D और E में कार्यरत कर्मचारियों की कुल संख्या का कितना प्रतिशत है?
View SolutionThe given Bar graph presents the Demand and Production of motorcycles of five companies (in lakhs)
दिया गया दंड आरेख पांच कंपनियों के संबंध में मोटरसाइकिलों की मांग और उत्पादन ( लाख में ) को दर्शाता है|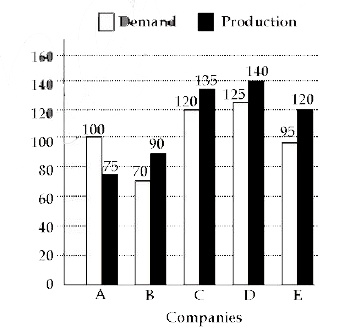 What is the ratio of the total Demand of motorcycles of companies A and D taken together to the Production of motorcycles of company C?
कंपनी A और D को मिलाकर मोटरसाइकिलों की कुल मांग का कंपनी C की मोटरसाइकिलों के उत्पादन के साथ अनुपात ज्ञात करें |
View Solution
