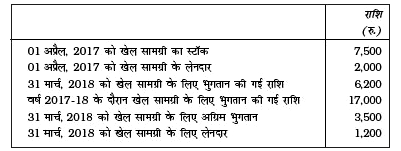
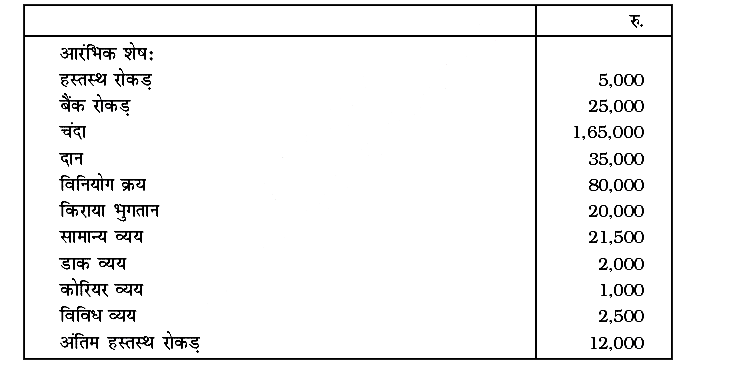
31 मार्च, 2018 समाप्त वर्ष के आय और व्यय खाते में खेल सामग्री की किस राशि को दर्शाया जाएगा।

Step by step video & image solution for 31 मार्च, 2018 समाप्त वर्ष के आय और व्यय खाते में खेल सामग्री की किस राशि को दर्शाया जाएगा। by Accounts experts to help you in doubts & scoring excellent marks in Class 12 exams.
Topper's Solved these Questions
- BOOK - NCERT HINDICHAPTER - अलाभकारी संस्थाओ के लिए लेखांकन EXERCISE - स्वयं जाँचिए 110videos
अलाभकारी संस्थाओ के लिए लेखांकन
- BOOK - NCERT HINDICHAPTER - अलाभकारी संस्थाओ के लिए लेखांकन EXERCISE - स्वयं जाँचिए 24videos
अलाभकारी संस्थाओ के लिए लेखांकन
- BOOK - NCERT HINDICHAPTER - अलाभकारी संस्थाओ के लिए लेखांकन EXERCISE - अंकिक प्रश्न18videos
अलाभकारी संस्थाओ के लिए लेखांकन
- BOOK - NCERT HINDICHAPTER - अंशपूँजी के लिए लेखांकन EXERCISE - अभ्यास के लिए प्रश्न ( संख्यात्मक प्रश्न)22videos
अंशपूँजी के लिए लेखांकन
- BOOK - NCERT HINDICHAPTER - ऋणपत्रों का निर्गम एवं मोचनEXERCISE - अभ्यास हेतु प्रश्न (संख्यात्मक प्रश्न)2videos
ऋणपत्रों का निर्गम एवं मोचन
Similar Questions
कारण सहित बताइए कि निम्न कथन सत्य या असत्य है:
प्राप्ति और भुगतान खाता सभी पूँजीगत प्राप्तियों और भुगतानों का सारांश है।01:33View Solutionएक अलाभकारी संस्थान के लिए आप दी गई मदों की स्थिति में किस प्रकार व्यवहार करेंगे?
प्रतियोगिता निधि 40,000 रु., प्रतियोगिता व्यय 14,000 रु., प्रतियोगिता से प्राप्तियाँ 16,000 रु.।02:21View Solutionएक हैल्थ क्लब की रोकड़ पुस्तक से लिए गए निम्न विवरणों द्वारा प्राप्ति एवं भुगतान खाता तैयार कीजिए।
 03:46View Solution
अनीश लिमिटेड ने 100 रु. प्रत्येक के 30,000 समता अंशों का निर्गमित किया जो 30 रु. आवेदन पर, 50 रु. आबंटन पर, और 20 रु. प्रथम और अंतिम माँग पर देय हैं। सभी राशि विधिवत प्राप्त की गईं। इन व्यवहारों को कंपनी के रोजनामचे में अभिलेखित करें।
02:45View Solutionबी लिमिटेड ने मोहन ब्रदर्स से 4,00,000 रु. की खाता-मूल्य वाली परिसंपत्तियाँ खरीदी और 50,000 की देनदारियों की ज़िम्मेदारियों भी प्राप्त की। यह तय हुआ कि खरीद प्रतिफ़ल के रूप में 3,80,000 रु. का भुगतान 100 रु. प्रत्येक के ऋणपत्र द्वारा किया जाएगा। इन तीन प्रकरणों में क्या रोज़नामचा प्रविष्टियाँ अभिलिखित की जाएँगी यदि ऋणपत्रों का निर्गमन (क) सममूल्य पर (ख) बट्टे पर तथा (ग)10% प्रीमियम पर किया गया है। यह भी तय हुआ कि ऋणपत्रों में किसी भी प्रकार की भिन्नता आने पर इनका रोकड़ में भुगतान कर दिया जाएगा। (टिप्पणी- ख्याति 30,000 रु. )
01:52View Solutionदृश्य-श्रव्य सामग्री की आवश्यकता निम्न में से किस विधि के लिए आवश्यक नहीं है?
01:32View SolutionIncomes of A and B are in the ratio of 5 : 3 and their expenditures are in the ratio of 9 : 5. If the income of B is equal to the expenditure of A, then what is the ratio of the savings of A and B?
02:46View SolutionThe income of A is 60% less than that of B, and the expenditure of A is equal to 60% of B’s expenditure. If A’s income is equal to 70% of B’s expenditure, then what is the ratio of the saving of A and B?
A की आय B की आय से 60% कम है, तथा A का व्यय B के व्यय के 60% के बराबर है | यदि A की आय B के व्यय के 70% के बराबर है, तो A और B की बचत का अनुपात क्या है ?03:08View SolutionThe given Bar Graph presents Income and Expenditure (in crores of Rupees) of a company for the five years, 2014 to 2018. दिया गया दंड आरेख पांच वर्षों अर्थात 2014 से 2018 तक एक कंपनी के आय एवं व्यय ( करोड़ रुपये में ) को दर्शाता है | In which year is the Expenditure more than 40% as compared to the Expenditure in the previous year? किस वर्ष में व्यय पिछले वर्ष के व्यय की तुलना में 40% अधिक है ?
04:39View SolutionThe given Bar Graph presents Income and Expenditure (in crores of Rupees) of a company for the five years, 2014 to 2018. दिया गया दंड आरेख पांच वर्षों अर्थात 2014 से 2018 तक एक कंपनी के आय एवं व्यय ( करोड़ रुपये में ) को दर्शाता है | What is the ratio of total Expenditure to total Income of the company in 2014, 2016 and 2017? 2014, 2016 और 2017 में कंपनी के कुल व्यय और कुल आय में क्या अनुपात है ?
01:43View SolutionThe given Bar Graph presents Income and Expenditure (in crores of Rupees) of a company for the five years, 2014 to 2018. दिया गया दंड आरेख पांच वर्षों अर्थात 2014 से 2018 तक एक कंपनी के आय एवं व्यय ( करोड़ रुपये में ) को दर्शाता है | What is the ratio of the total revenue of the company in 2015 and 2018 to that of its expenditure in 2014 and 2018? 2015 तथा 2018 में कंपनी की कुल आय और 2014 तथा 2018 में कंपनी के कुल व्यय में क्या अनुपात है ?
01:42View SolutionThe given Bar Graph presents Income and Expenditure (in crores of Rupees) of a company for the five years, 2014 to 2018. दिया गया दंड आरेख पांच वर्षों अर्थात 2014 से 2018 तक एक कंपनी के आय एवं व्यय ( करोड़ रुपये में ) को दर्शाता है | In which year the percentage increase in the income as compared to that in its preceding year is between 5% and 8%? किस वर्ष आय में प्रतिशत वृद्धि पिछले वर्ष की तुलना में 5% से 8% के बीच है ?
01:32View SolutionThe given Bar Graph presents Income and Expenditure (in crores of Rupees) of a company for five years, 2014 to 2018. The total Income of the company in 2015, 2017 and 2018 is approximately what percent less than the total Expenditure in the five years? दिया गया दंड आरेख (बार ग्राफ) 5 वर्षो, 2014 से 2018 के दौरान किसी कंपनी की आय और व्यय (करोड़ रुपए में) को दर्शाता है 2015, 201 और 2018 में कंपनी की कुल आय, 5 वर्षो में कुल व्यय से लगभग कितने प्रतिशत कम है?
04:58View SolutionThe given Bar Graph presents Income and Expenditure (in crores of Rupees) of a company for five years, 2014 to 2018. In which year is the Expenditure more than 40% as compared to the Expenditure in the previous year? दिया गया दंड आरेख (बार ग्राफ) 5 वर्षो, 2014 से 2018 के दौरान किसी कंपनी की आय और व्यय (करोड़ रुपए में) को दर्शाता है| पिछले वर्ष के व्यय की तुलना में किस वर्ष में वह 40% अधिक है?
View SolutionThe given Bar Graph presents Income and Expenditure (in crores of Rupees) of a company for five years, 2014 to 2018. What is the ratio of total Expenditure to total Income of the company in 2014,2016 and 2017? दिया गया दंड आरेख (बार ग्राफ) 5 वर्षों, 2014 से 2018 के दौरान किसी कंपनी की आय और व्यय (करोड़ रुपए में) को दर्शाता है| 2014, 2016 और 2017 में कंपनी के कुल व्यय और कुल आय का अनुपात क्या है?
01:28View SolutionThe given Bar Graph presents the Revenue and Expenditure (in crores of Rupees ) of a company during the five year period , 2014 - 2018. दिया गया दंड आरेख (bar graph) 5 वर्ष की अवधि 2014-2018 के दौरान किसी कंपनी के राजस्व और व्यय (करोड़ रुपए में ) को दर्शाता है। The expenditure of the company in 2017 is what percentage less than the average revenue ( per year ) in 2014, 2015 and 2016 ? वर्ष 2017 में कंपनी का व्यय, वर्ष 2014, 2015 और 2016 में औसत राजस्व (प्रति वर्ष) से कितने प्रतिशत कम है?
01:10View Solution

