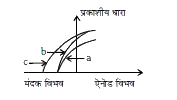
The figure shows a plot of photocurrent versus anode potential for a phtot sensitive surface fo three different radiations.
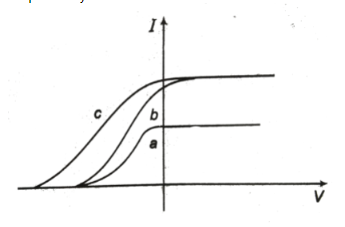
which one of the following is a correct statement?Solution in Punjabi
Curves a and b represent incident radiations of different frequencies and different intensities
Curves a and b represent incident radiations of the same frequency but no different intensities
Curves b and c represent incident radiations of different frequencies and different intensities
Curve b and c represent incident radiations of the same frequency having the same intensity
Step by step video & image solution for The figure shows a plot of photocurrent versus anode potential for a phtot sensitive surface fo three different radiations.which one of the following is a correct statement? by Physics experts to help you in doubts & scoring excellent marks in Class 12 exams.
Updated on:21/07/2023Topper's Solved these Questions
Similar Questions
The photon of frequency v has a momntum associated with it .If c is the velocity of light,then momentum is
View SolutionTo get five images of a single object, one should have two plane mirrors at an angle of :
View SolutionProve that electromagnetic waves are transverse in nature.
View SolutionFigure shows the plot of the stopping potential versus the frequency of the light used in an experiment on photoelectric effect. The ratio (h)/(e) is
View SolutionThe figure shows a plot of photo current versus anode potential for a photosensitive surface for three different radiations. Which one of the following is a correct statement ?
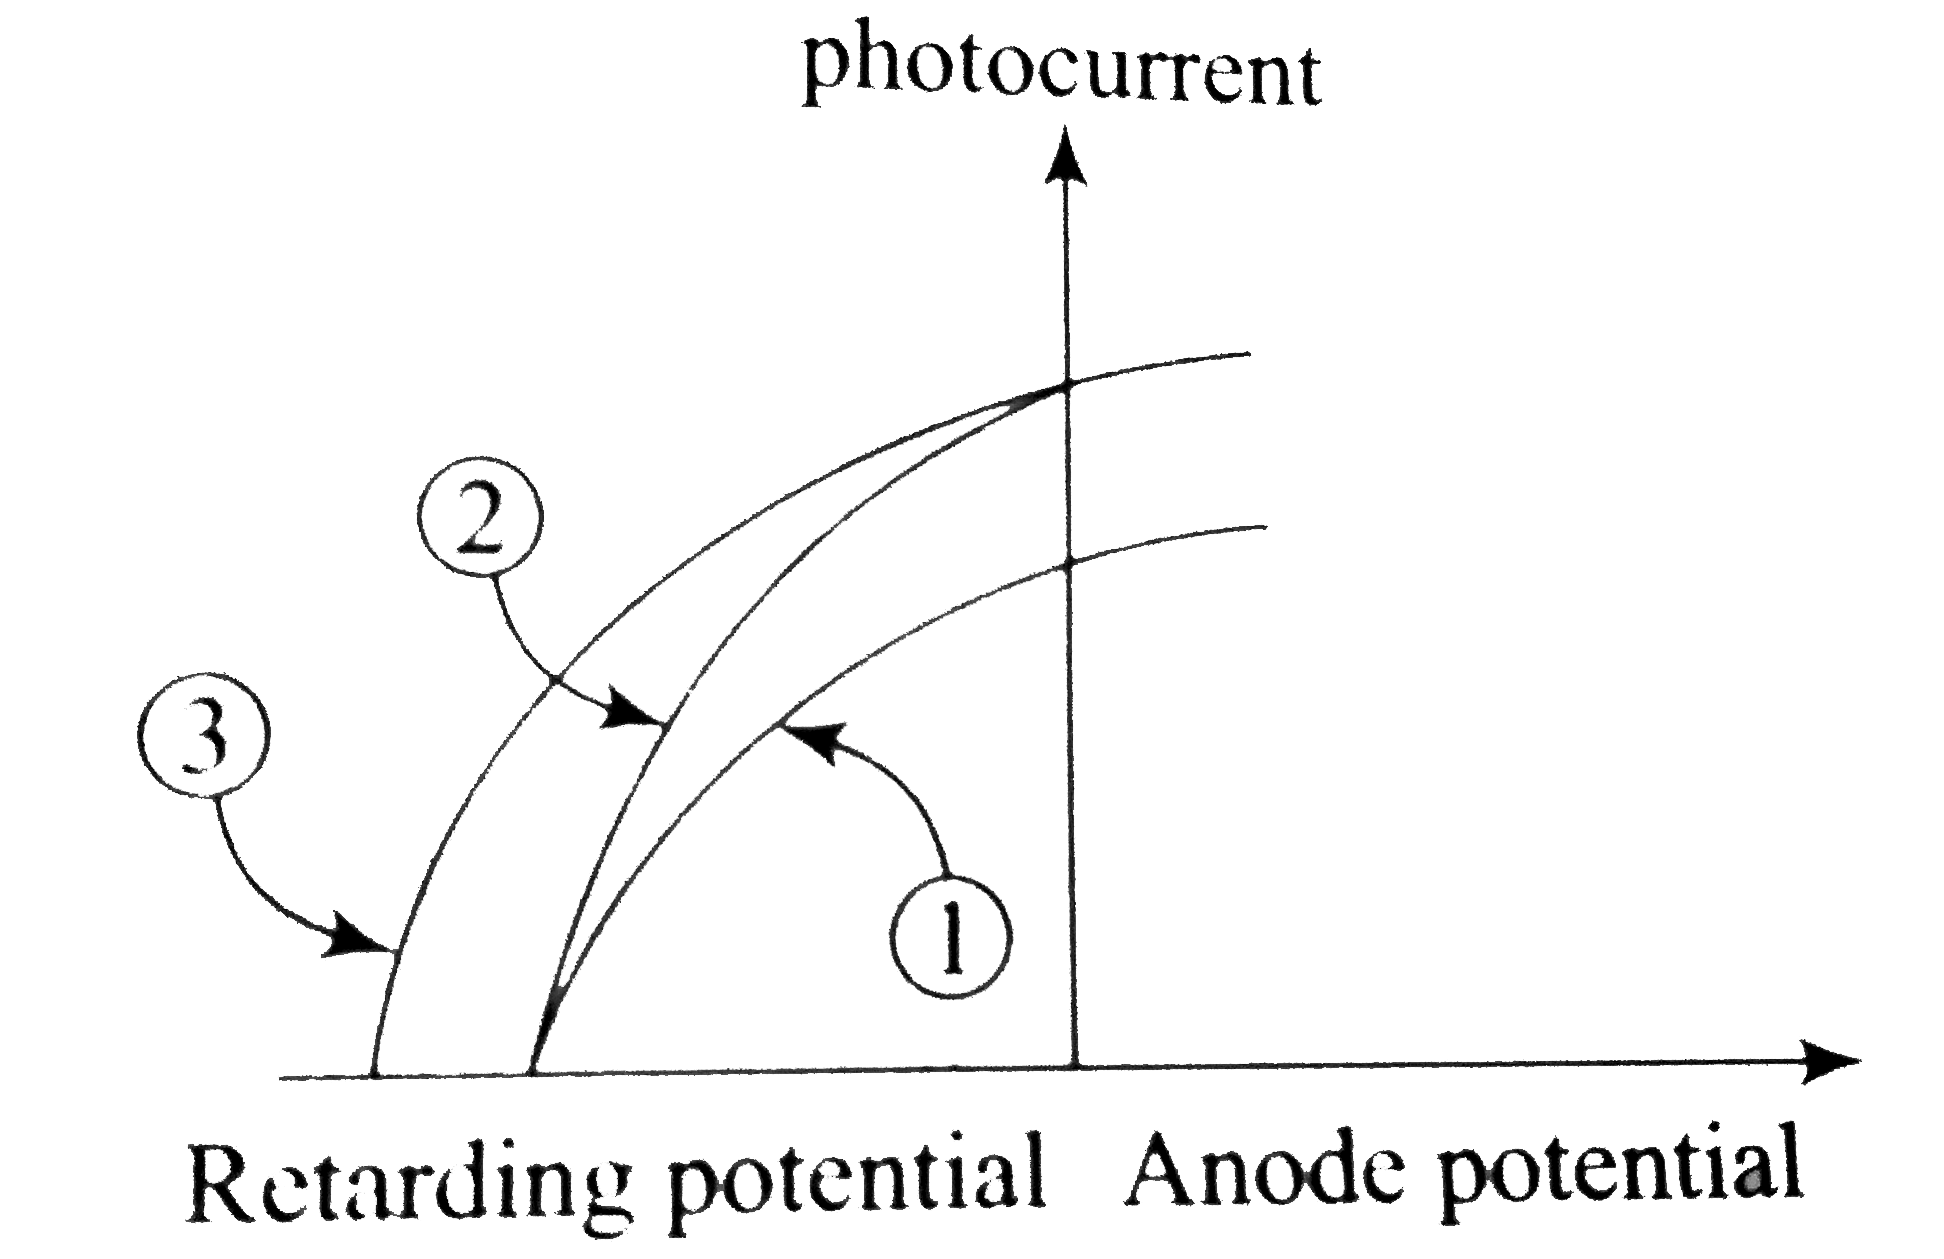
View SolutionPlot a graph showing the variation of photoelectric current with anode potential for two light beam of same wavelength but different intensity.
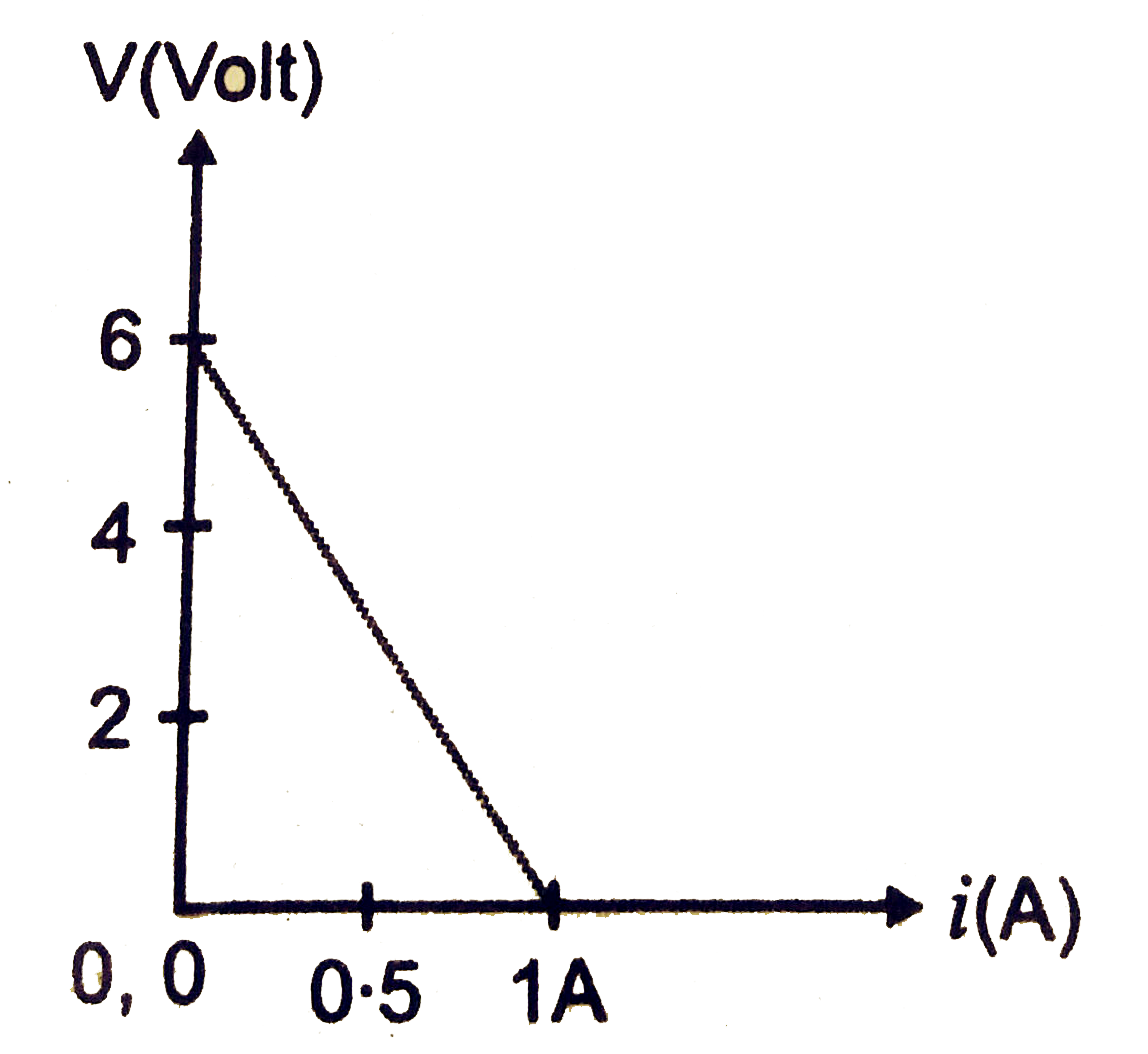
View SolutionThe plot of the variation of potential difference across a combination of three identical cells in series, versus current is as shown in figure. What is the emf and internal resistance of each cell?
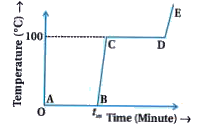
View SolutionRefer to the plot of temperature versus time (figure) showing the changes in the state if ice on heating (not to scale). Which of the following is correct ? .
View SolutionIn photoelectric experiment the plot between anode potential and photoelectric current is shown in figure 2.3.1. Which of the following is correct:
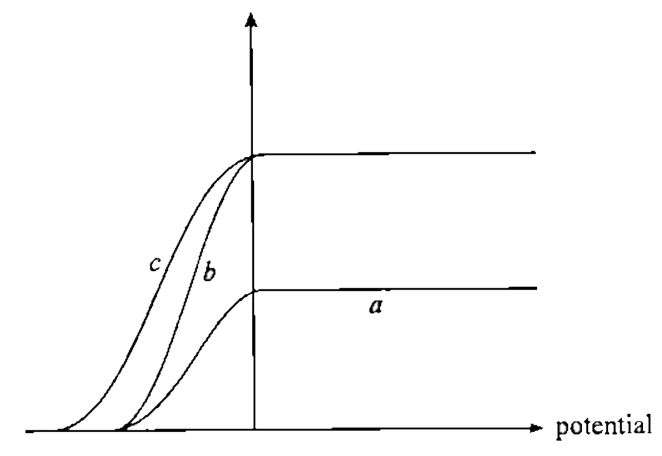
View SolutionTwo photocathodes are illuminated by the light emitted by a single source. The dependence of photocurrent versus voltages between cathode and anode is shown by curves 1 and 2 as shown in the figure. (I/I_(max) represents ratio of photocurrent to saturation current):
View Solution(a) Define the terms , (i) threshold frequency and (ii) stopping potential in photoelectric effect.
(b) Plot a graph of photocurrent versus anode potential for a radiation of frequency v and intensities I1andI2.
(I1<I2) .
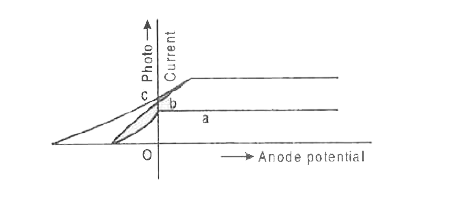
View SolutionFig. shows variation of photocurrent with anode potential for photosensitive surface for three different radiations. Let Ia,Ib and Ic be the intensities and fa,fb and fc the frequencies for curves a, b to c, then:
View SolutionRefer to the plot of temperature versus time figure showing the changes in the state of ice on heating (not to scale). Which of the following is correct ?
View Solutionइस चित्र में एक प्रकाश सक्रिय तल के लिए तीन विभिन्न विकिरणों के लिए प्रकाशीय धारा और ऐनोड विभव के बीच आरेखों को दिखाया गया है। निम्न कथनों में से किस को यथार्थ मन जायेगा ?
View SolutionRefer to the plot of temperature versus time (figure) showing the changes in the state if ice on heating (not to scale). Which of the following is correct ? .
View SolutionThe plot of the variation of potential difference across a combination of three identical cells in series, versus current is as shown in figure. What is the emf and internal resistance of each cell?
View Solution
