Directions The pie-charts, given here show some automobile parts manufactured by an automobile company at its Pune and Nagpur plants in the year 2009. Study the pie-charts and answer questions.
 The ratio of number of horns produced at Nagpur plant to that produced at Pune plant is (A) 3 :7 (B) 10 :3 (C) 7 :3 (D) 7 :10
D
A
B
C
Step by step video & image solution for Directions The pie-charts, given here show some automobile parts manufactured by an automobile company at its Pune and Nagpur plants in the year 2009. Study the pie-charts and answer questions. The ratio of number of horns produced at Nagpur plant to that produced at Pune plant is (A) 3 :7 (B) 10 :3 (C) 7 :3 (D) 7 :10 by Maths experts to help you in doubts & scoring excellent marks in Class 14 exams.
Updated on:21/07/2023Similar Questions
Direction :- Study the histogram and answer the following questions
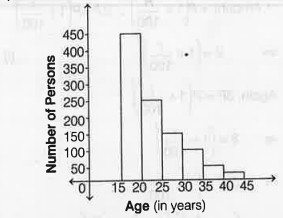 .
.
The ratio of the number of persons between the age group of 20-25 and 30-35 is
(A) 1:3
(B) 2:1
(C ) 10:3
(D) 6:1
View SolutionThe pie chart shows the shares of 6 partners in certain company. Study the diagram and answer the following questions.
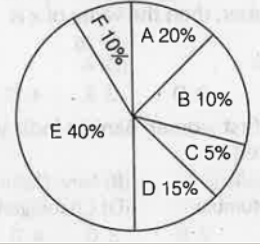
Ratio of shares of E and B to those of A, C, D and F is
(A) 1 : 2
(B) 2 : 1
(C) 1 : 1
(D) 1 : 3
View Solution
Knowledge Check
The pie chart, given here show some automobile parts manufactured by an automobile company at its Pune and Nagpur plants in the year 2009.
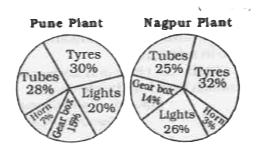
If the Nagpur plant produced 8,00,000 tyres, then the number of horns produced by it wasA(A) 12000B(B) 18500C(C) 75000D(D) 60000The pie chart, given here show some automobile parts manufactured by an automobile company at its Pune and Nagpur plants in the year 2009.
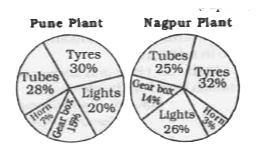
The ratio of number of horns produced at Nagpur plant to that produced at Pune plant isA3:7B10:3C7:3D7:10The pie chart, given here show some automobile parts manufactured by an automobile company at its Pune and Nagpur plants in the year 2009.
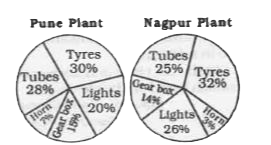
How many percent more tubes were produced at the Pune plant than those produced at the Nagpur plant?A(A) 14%B(B) 12%C(C) 8%D(D) 3%
Directions The following questions are based on the given pie-chart.Study the pie-chart and answer the questions.
 The central angle for the sector on "Paper-Cost" is (A) 2212 (B) 16∘ (C) 54.8∘ (D) 36∘
View SolutionDirection :- Following is the pie-chart showing the spendings of a family on various items in a particular year Study the pie chart and answer questions.
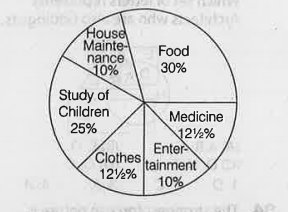 If the total amount spet on the family during the year was Rs. 35000, then the amount spent for stud of children and food together was (A) Rs. 19250 (B) Rs. 19500 (C) Rs.19750 (D) Rs. 19850
View SolutionThe pie chart shows the annual car production (percentage wise) of six countries A,B,C,D,E and F.
Study the pie chart and answer the question.
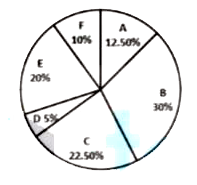
Total number of cars produced =40,00,000
The number of cars produced by country B is what percent more than that produced by country E?
View SolutionDirection: The following pie chart shows the percentage of production of books by different companies in a year. Read the chart and answers the following questions.
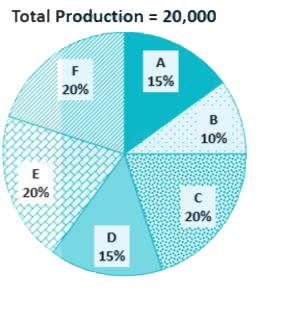
Find the average production of books by company B and C:
View SolutionGiven here is a pie chart showing the cost of gold in 2010, 2011, 2012 and 2013. Study the chart and answer the following questions.
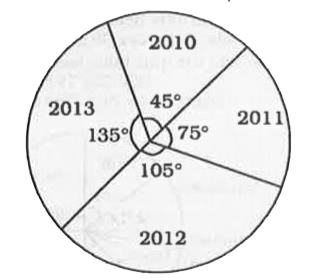
The ratio of the price of gold in the two years 2010 and 2013 is
View Solution
