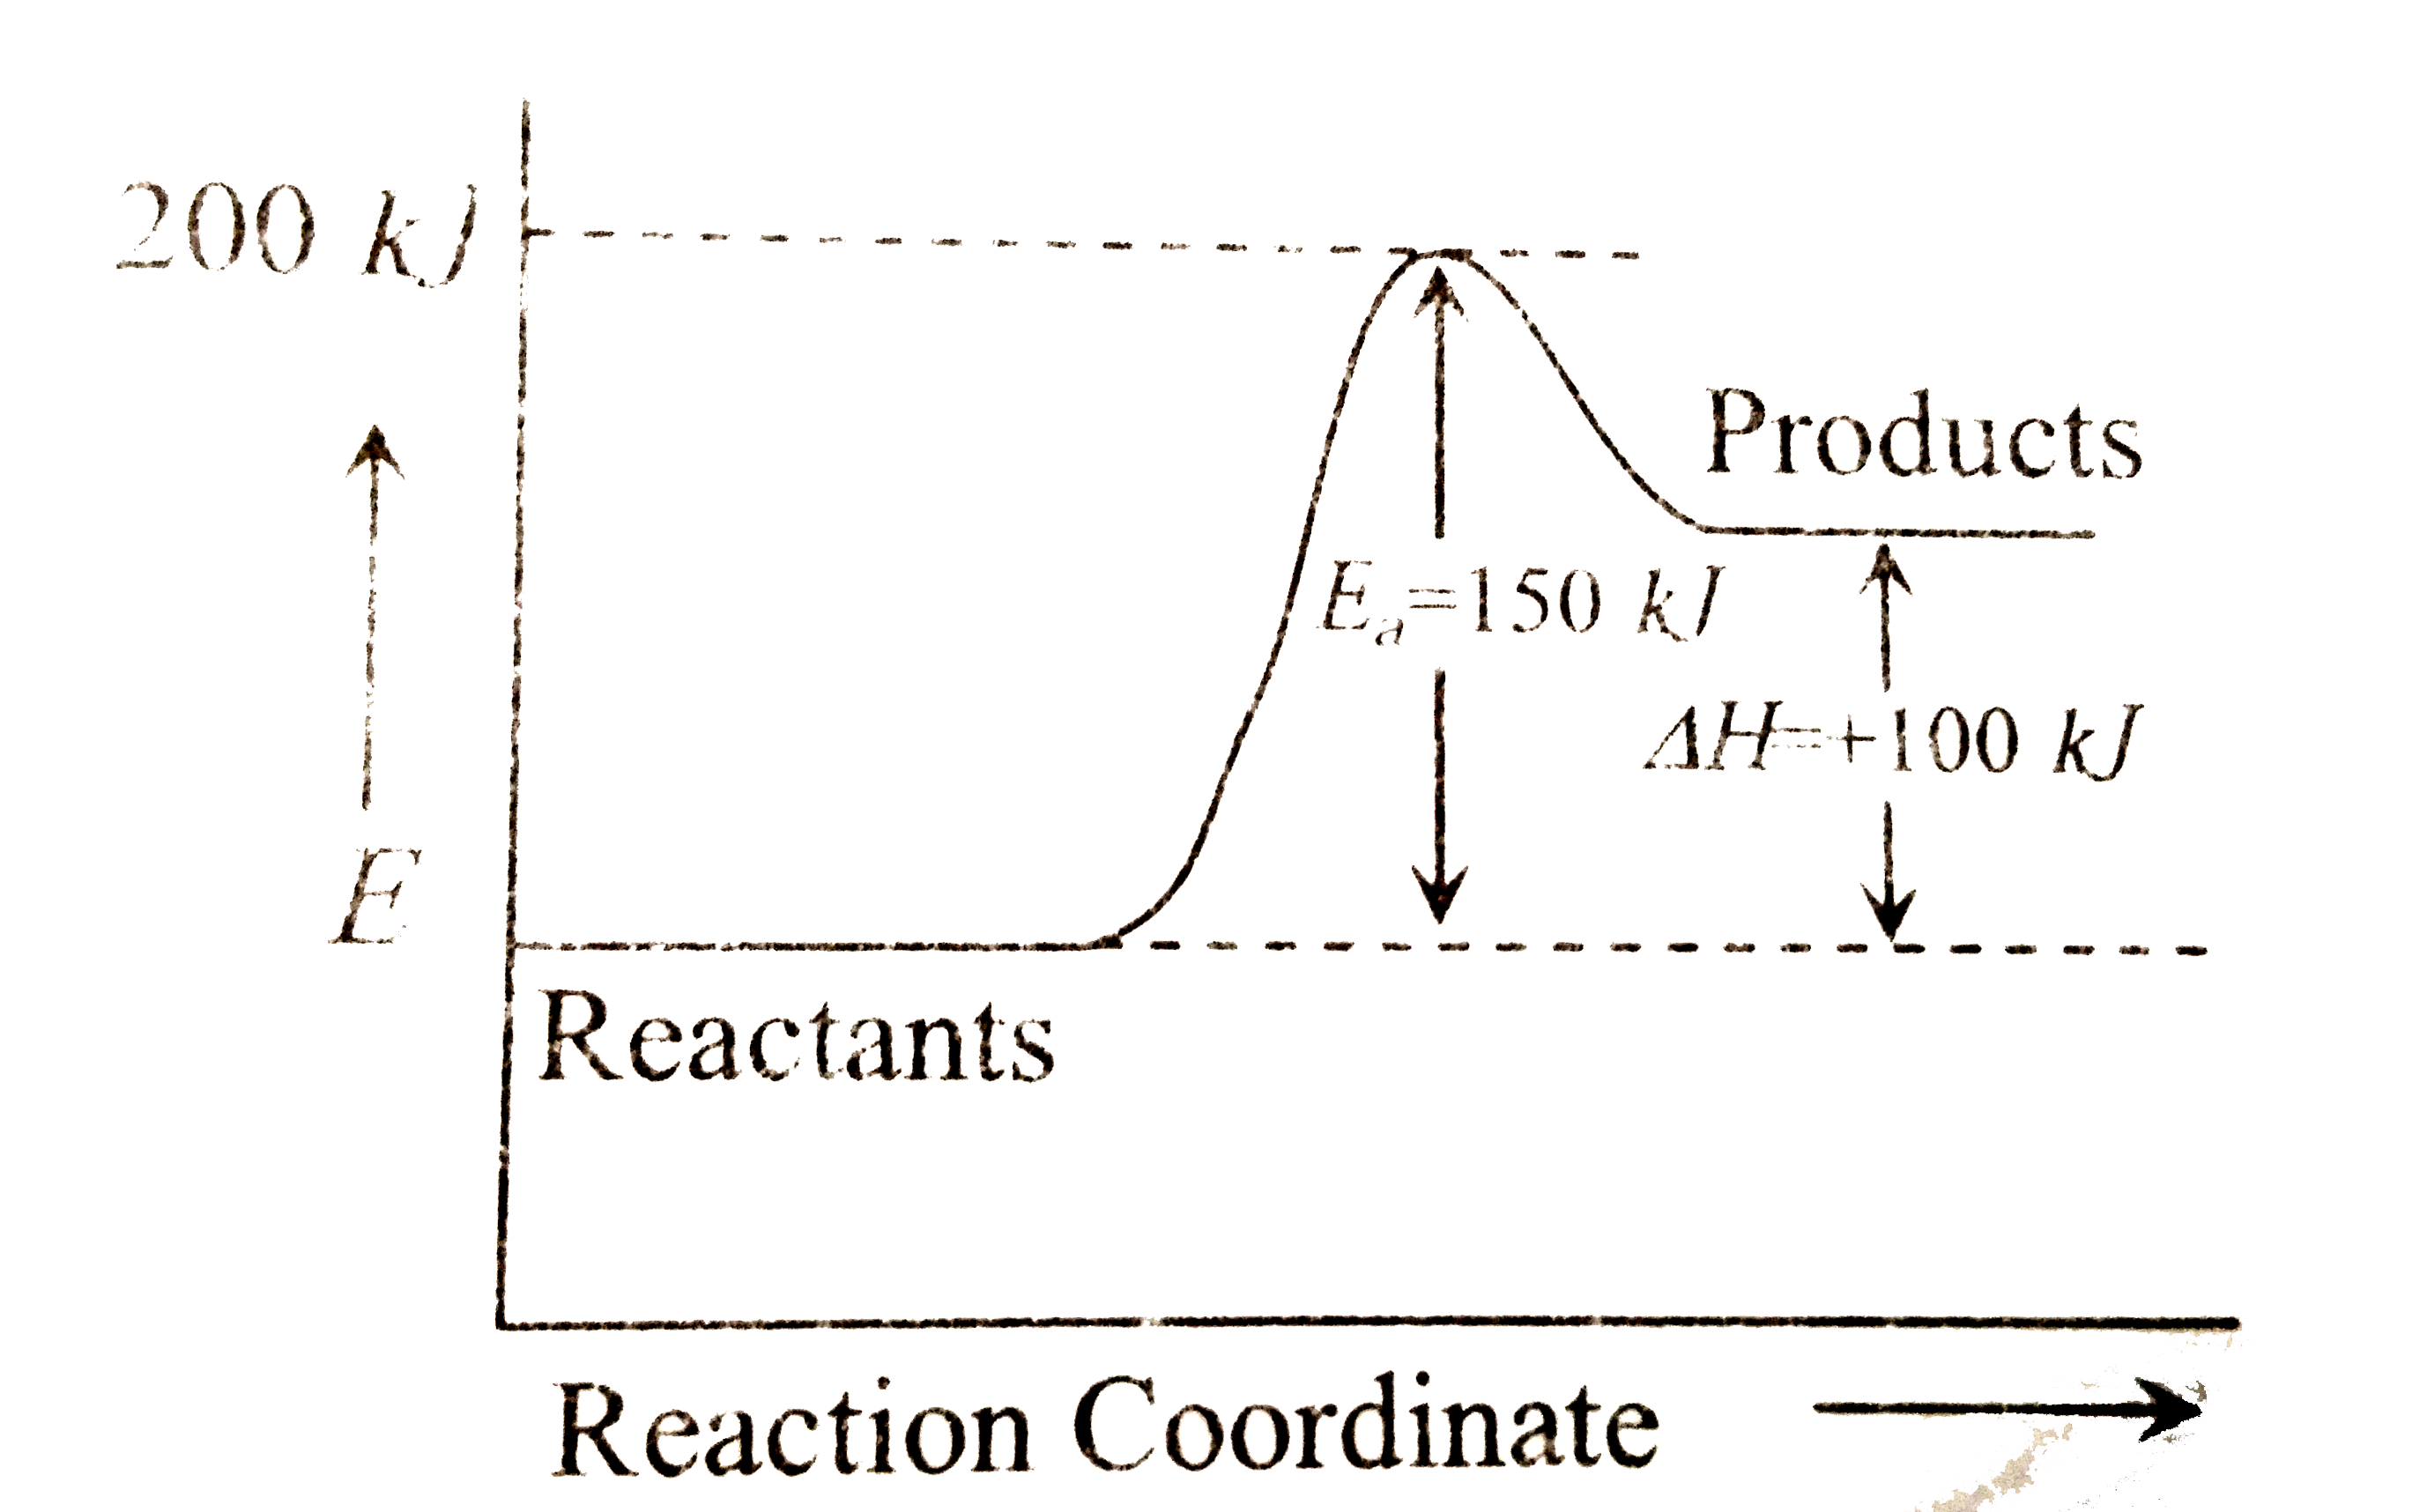
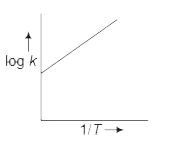
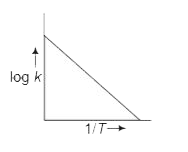
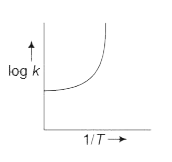
A graph is ploted between log K virsus 1T for calculation of activation energy (Ea). The correct plot is
A
B
C
D
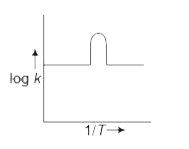
Video Solution
Text Solution
The correct Answer is:b
According to Arrhenius equation .s
log K=logA−Ea2.303R1T
on comparing it with the equation of st . Line y= mx + c plot (b) is the correct answer.
|
Topper's Solved these Questions
Similar Questions
Knowledge Check
A graph plotted between logk versus 1/T for calculating activation energy is shown by
A B
B C
C D
D
A graph plotted between logk versus 1/T for calculating activation energy is shown by
A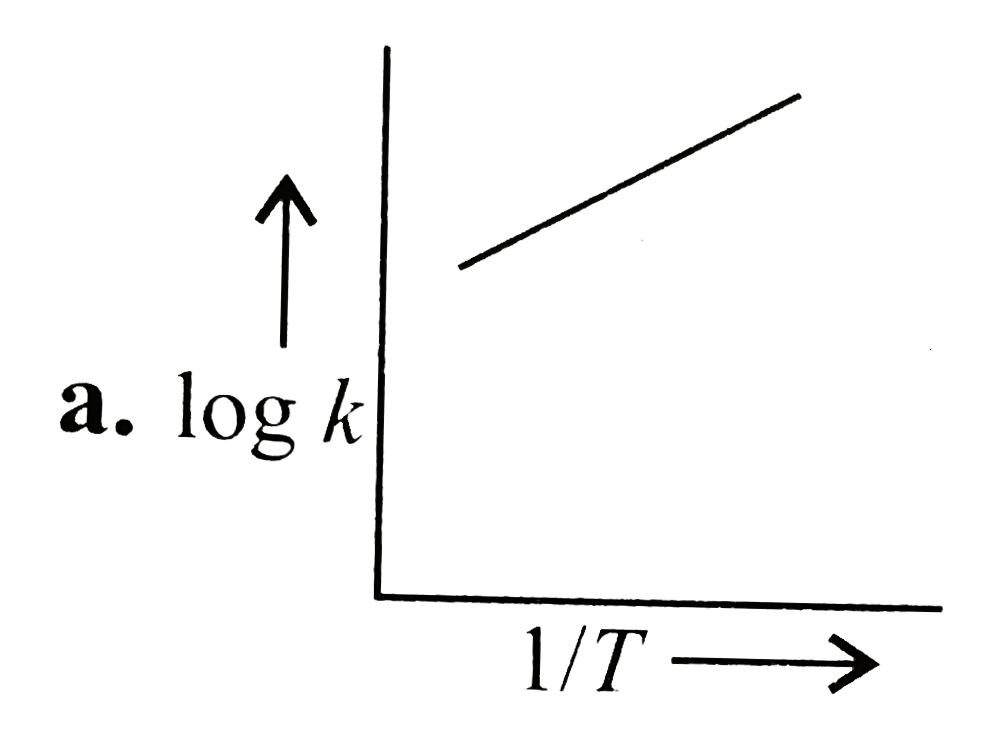 B
B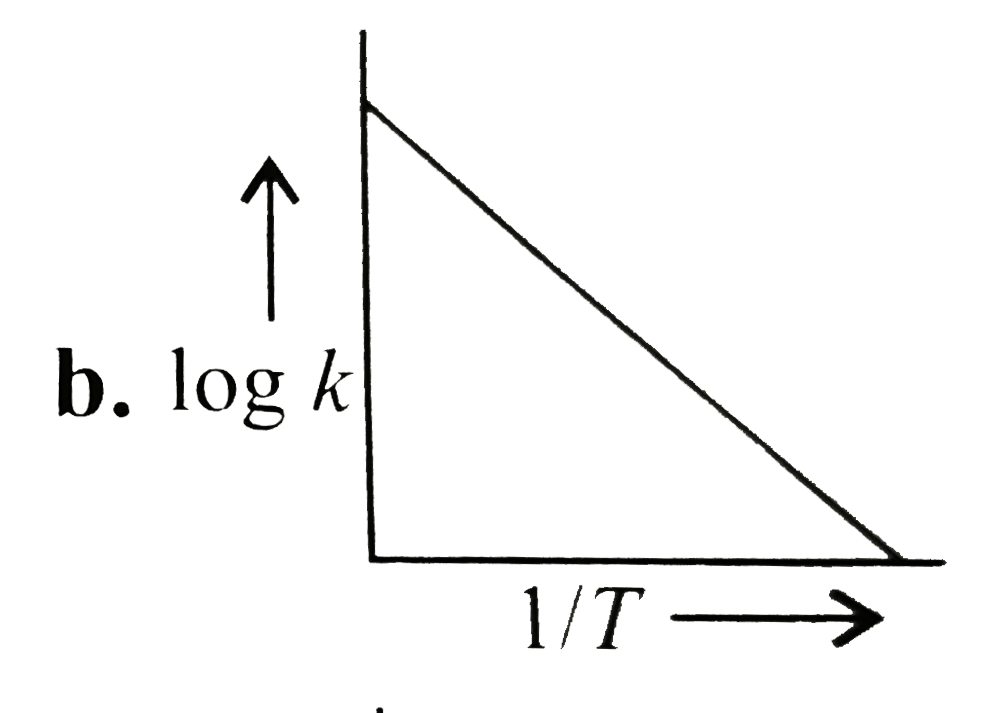 C
C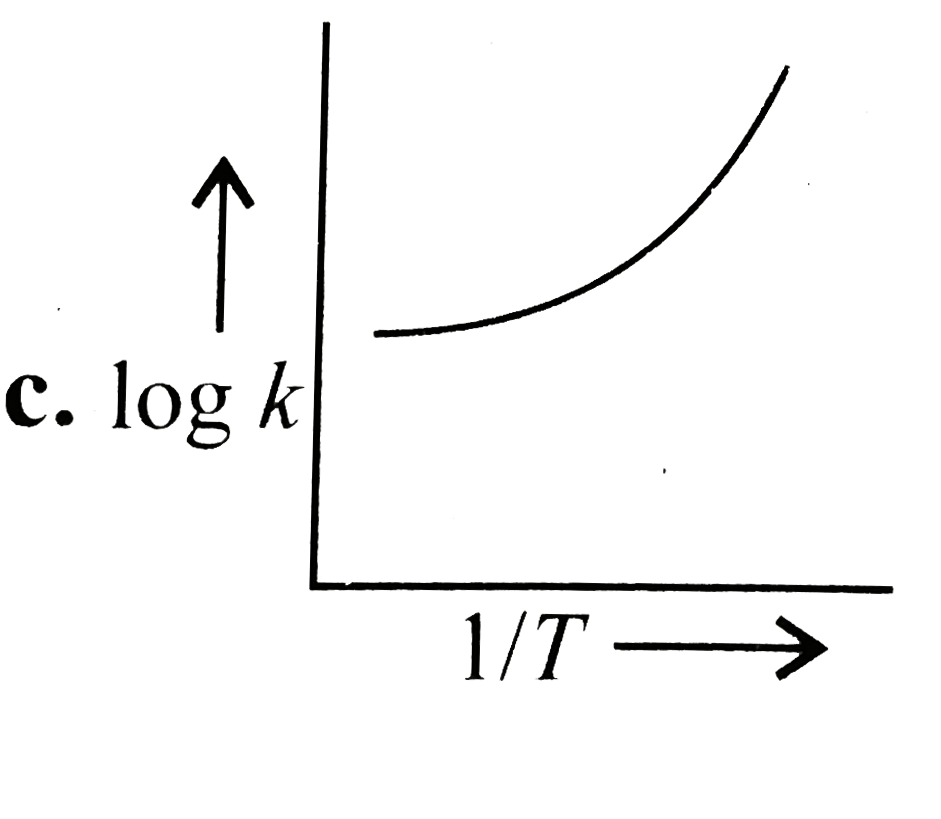 D
D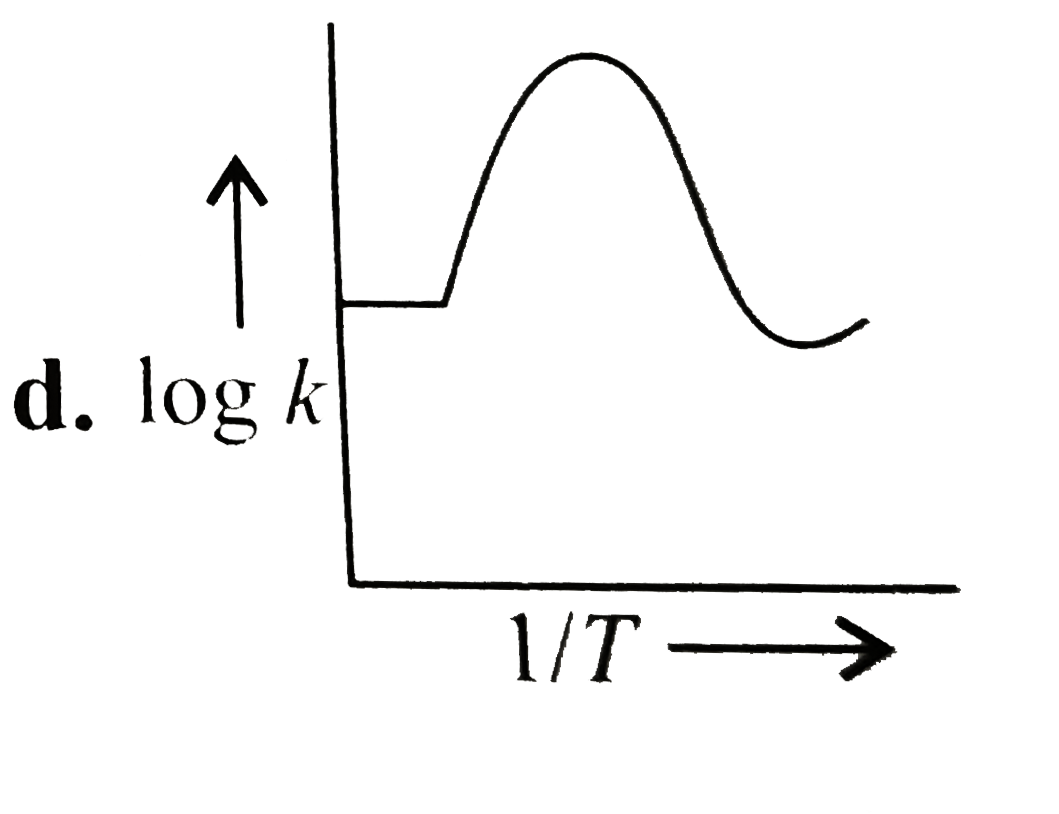
A graph plotted between logk versus 1/T for calculating activation energy is shown by
A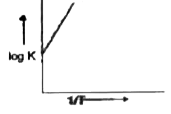 B
B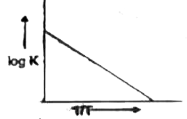 C
C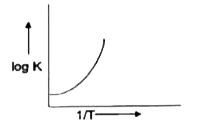 D
D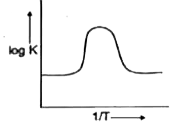
A graph plotted between log k vs 1T is represented by
View SolutionThe slope of straight line graph between ln k us 1T is equal to 2.4×10⁴K. Calculate the activation energy of the reaction at 400 K. (K represents rate constant)
View SolutionThe plot of log k vs 1/T helps to calculate
View SolutionThe plot og logk vs 1/T helps to calculate
View SolutionIf a graph is plotted between ln k and 1/T for the first order reaction, the slope of the straight line so obtained is given by
View Solution

