Annual expenditure of a company in the year 2007-2008 is given below:
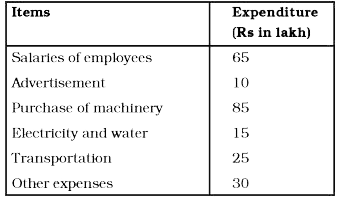
Prepare a pictograph of the above data using an appropriate symbol to represent Rs 10 lakh.
Step by step video & image solution for Annual expenditure of a company in the year 2007-2008 is given below: Prepare a pictograph of the above data using an appropriate symbol to represent Rs 10 lakh. by Maths experts to help you in doubts & scoring excellent marks in Class 6 exams.
Topper's Solved these Questions
Similar Questions
The number of bottles of cold drinks sold by a shopkeeper on six consecutive days is as follows:

Prepare a pictograph of the above data using an appropriate symbolView SolutionTotal number of students of a school in different years is shown in the following table.
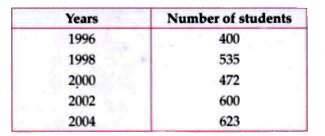
Prepare another pictograph of students using any other symbol each representing 50 students. Which pictograph do you find more informative ?View SolutionDraw a pictograph to represent the data given below :
 View Solution
The following table gives information about the circulation of newspapers (dailies) in a town in five languages.

Prepare a pictograph of the above data, using a symbol of your choice, each representing 1000 newspapers.View SolutionThe expenditure of a family of different heads in a month is given below

Draw a bar graph to represent the data above.View SolutionTotal number of students of a school in different years is shown in the following table: Year, No. of Students 1996 1998 2000 2002 2004, 400 550 450 600 650 Represent the above data by a pictograph. Prepare a pictograph of students using one symbol an icon of a student to represent 100 students and answer the following questions: How many symbols represent total number of students in the year 2002? How many symbols represent total number of students in the year 1998? Prepare another pictograph of students using any other symbol each representing 50 students. Which pictograph do you find more informative?
View SolutionThe item-wise expenditure of a Non-Government Organisation for the year 2008 - 2009 is given below:
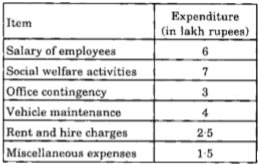
The above data are represented by a pie diagram.
What is the sectorial angle of the largest sector ?View SolutionThe item-wise expenditure of a Non-Government Organisation for the year 2008 - 2009 is given below:
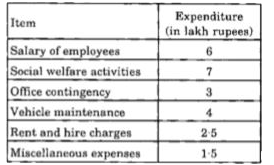
The above data are represented by a pie diagram.
What is the difference in the sectorial angles of the largest and smallest sectors ?View SolutionThe following table shows the area of the land on which different crops were grown.
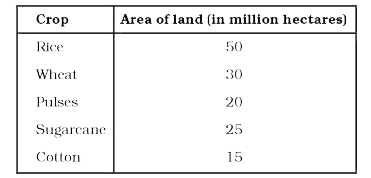
Prepare a pictograph by choosing a suitable symbol to represent 10 million hectares.View SolutionStudy the following table and answer the question. Expenditures of a Company in Lakh Rupees) per annum over the given years.
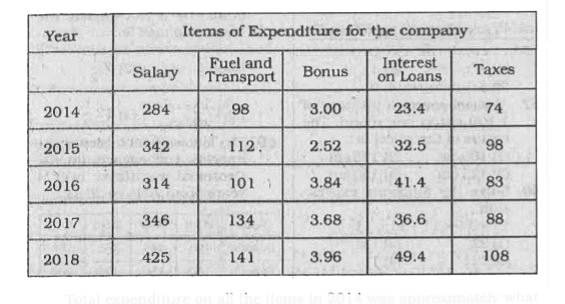
Total expenditure on all the items in 2014 was approximately what percent of the total expenditure in 2018?View Solution

