Items sold in 2014 is how much percent more than items produced by company in 2017.
50.88%
42.8%
55.88%
65.88%
The correct Answer is:C
Similar Questions
Study the following graph which shows the production (in thousands)of different items, and answer these questions
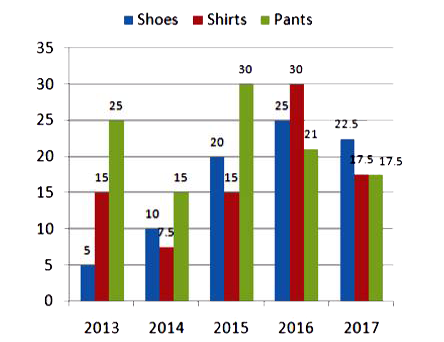
The difference between the total number of Shoes and Shirts produced by the company in the year 2016 and the number of Pants produced by the company in the year 2014 is:
View SolutionThe sale of pens in 2014 is decreased by how much percent to the sale of pen in 2012.
View Solution
Knowledge Check
The table given below shows the production (in '000 tonnes) of five companies from 2012 to 2016.
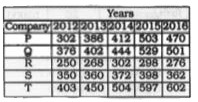
The production of company R in year 2014 is how much per cent more than the production of company R in the year 2013?A12.68B11.56C14.42D15.31The line chart given below shows the sales (in crores) of company A and B from July to December.
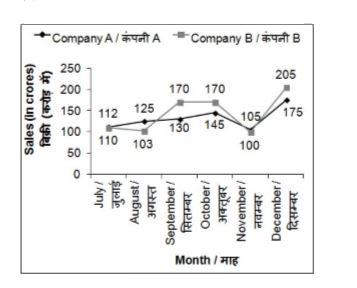
The sales of company A in November is how much percent more than the sales of company B in November?A5B10C8D15The marks in Hindi is how much percent more than the marks in Computer Science ?
A11.25%B12.5%C10%D15%
The sales of pens in 2012 is how much percent to the sales of pens in 2013, 2014.
View SolutionThe following table presents the number of units of a product produced and sold by a company during six years.
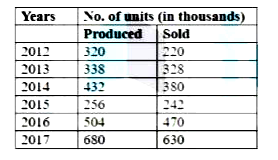
The number of units of the product sold in 2016 is approximately what percent more than the average production of the units in 2012 to 2016 ?
View SolutionThe given table represents the sale (in thousands) of cars by four companies A,B,C and D in six years. Study the table and answer the questions that follow. The total number of cars sold by companies A in 2017 and C in 2013 is what percentage of the total number of cars sold by all the four companies in 2013 and 2016?(correct to one decimal place)
दी गयी तालिका चार कंपनियों - A, B, C और D के द्वारा छः वर्षों में की गयी कारों की बिक्री ( हज़ार में ) दर्शाती है | इस तालिका का अध्ययन करें तथा फिर पूछे गए प्रश्नों के उत्तर दें |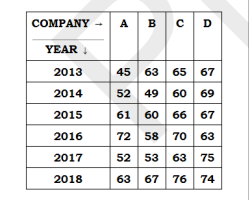
कंपनी A के द्वारा 2017 में तथा कंपनी C के द्वारा 2013 में बेची गयी कारों की कुल संख्या सभी चार कंपनियों के द्वारा 2013 से 2016 तक बेची गयी कारों की कुल संख्या का कितना प्रतिशत है ? ( दशमलव के एक स्थान तक )
View SolutionThe pie chart given below shows the imports of 7 different items P1, P2, P3, P4, PS, P6 and P7 as a percentage of total imports of a country.
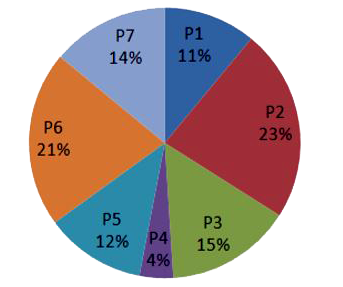
Imports of item P6 is how much percent more than the imports of item P5?
View SolutionDuring a seven - day period, a company produced 49,812 items that it considered acceptable and 21,348 items that it considered unacceptable. If the company produced a total of 10,830 items on the first day and the percent of the items produced on the first day that the company considered acceptable was the same percent of items that the company considered acceptable for the entire seven - day period, how many items produced by the company on the first day did the company consider acceptable ?
View Solution
