Study the following graph and answer the question based on the graph.
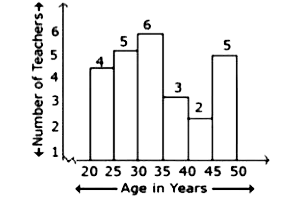
What percentage of the total number of teachers are aged less than 45 years?
60%
30%
80%
78%
The correct Answer is:C
Step by step video & image solution for Study the following graph and answer the question based on the graph. What percentage of the total number of teachers are aged less than 45 years? by Maths experts to help you in doubts & scoring excellent marks in Class 14 exams.
Updated on:21/07/2023Similar Questions
Study the following graph and answer the question based on the graph.
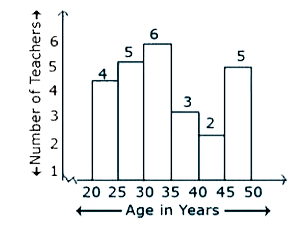
How many teachers are aged 45 years or more but less than 50 years?
View SolutionStudy the following graph and answer the question based on the graph.
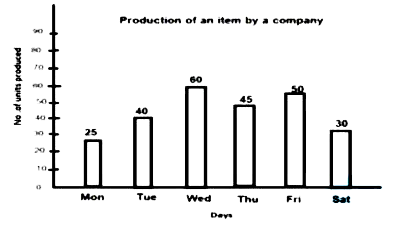
What was the percentage decline in the production from Friday to Saturday?
View Solution
Knowledge Check
Study the following table and answer the questions.

The ratio of the total number of students scoring marks less than 50% to that of scoring marks exactly 50% isA50:3B25:2C25:4D35:2Study the following graph carefully and answer the questions that follow
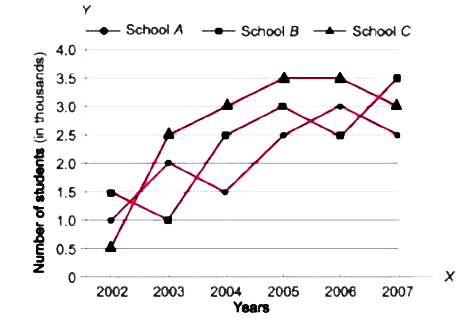
What was the average number of students in all schools together in the year 2006 ?A30000B9000C3000D6000Study the following graph carefully and answer the questions that follow
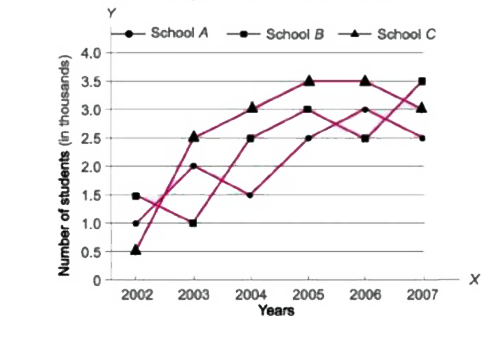
What was the difference between the total number of students in all schools together in the year 2003 and the number of students in school B in the year 2005 ?A2000B3000C3500D2500
Study the following graph and answer the question based on the graph.
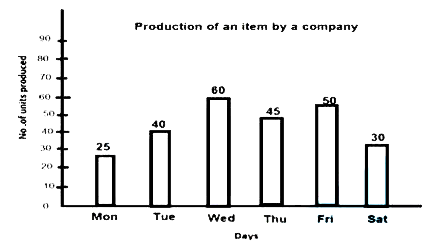
On which day the production was 1/5th of the total production?
View SolutionThe given bar graph represents the number of students who appeared in the board examination in session 2017-18 and 2018-19. Study the graph and answer the question that follows.
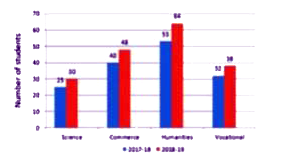
What percentage is the total number of students who appeared in 2017-18 is less than the total number of students who appeared in 2018-19?
View SolutionStudy the following bar graph and answer the questions given below.
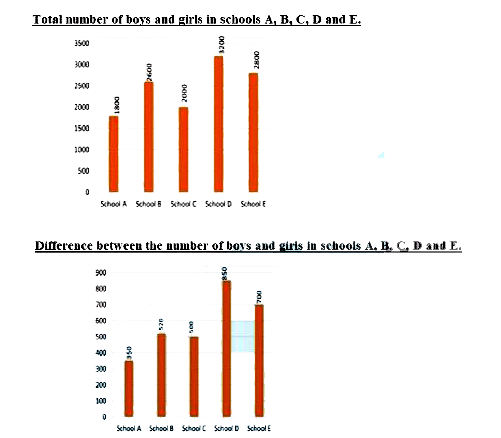
The number of boys in school B is what percentage of the total number of students in that school ?
View SolutionStudy the graph and answer the question that follows.
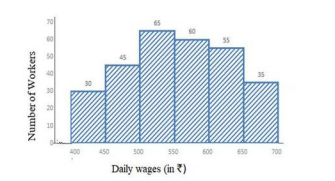 What is the ratio of the total number of workers whose daily wages are less than ₹ 500 to the total number of workers whose daily wages are ₹ 600 and above?
View SolutionStudy the graph and answer the question that follows
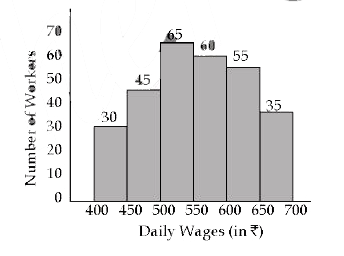
What is the ratio of the total number of workers whose daily wages are less than Rs 500 to the total number of workers whose daily wages are Rs 600 and above?
View Solution