The given bar graph represents the number of students who appeared in the board examination in session 2017-18 and 2018-19. Study the graph and answer the question that follows.
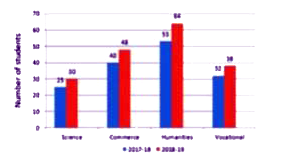
What percentage is the total number of students who appeared in 2017-18 is less than the total number of students who appeared in 2018-19?
15%
20.5%
12%
16.7%
The correct Answer is:D
Step by step video & image solution for The given bar graph represents the number of students who appeared in the board examination in session 2017-18 and 2018-19. Study the graph and answer the question that follows. What percentage is the total number of students who appeared in 2017-18 is less than the total number of students who appeared in 2018-19? by Maths experts to help you in doubts & scoring excellent marks in Class 14 exams.
Updated on:21/07/2023Similar Questions
The given bar graph represents the number of students who appeared in the board examination in session 2017-18 and 2018-19. Study the graph and answer the question that follows.
What is the ratio of the total number of students appeared in examination in 2017-18 and 2018-19?
View SolutionThe given bar graph represents the number of students who appeared in the board examination in session 2017-18 and 2018-19. Study the graph and answer the question that follows. What is the ratio of the total number of students appeared in examinations in 2017-18 and 2018-19?
दिया गया दंड आरेख सत्र 2017-18 और 2018-19 सत्र में बोर्ड परीक्षा में उपस्थित होने वाले छात्रों की संख्या को दर्शाता है। आरेख का अध्ययन करें और प्रश्न का उत्तर दें।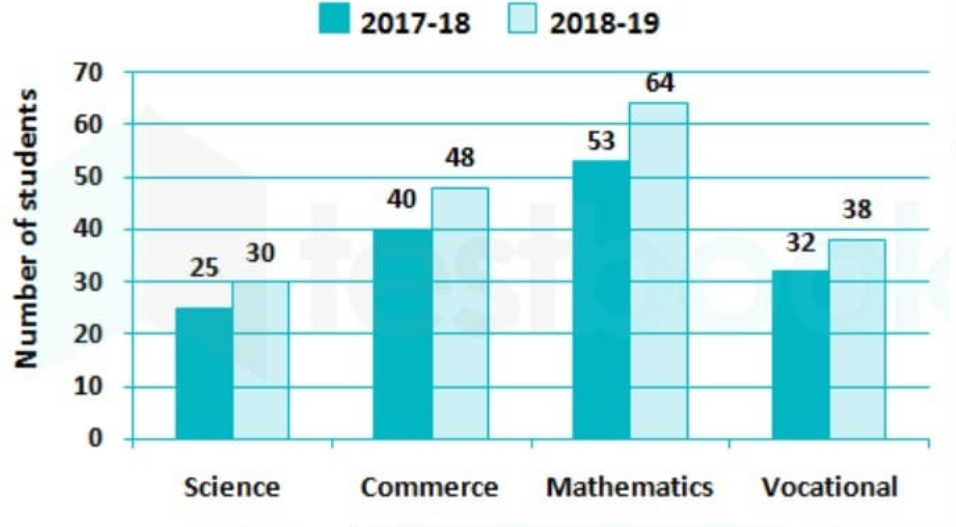
2017-18 और 2018-19 में परीक्षा में उपस्थित हुए छात्रों की कुल संख्या का अनुपात कया है ?
View Solution
Knowledge Check
Study the given graph and answer the question that follows .
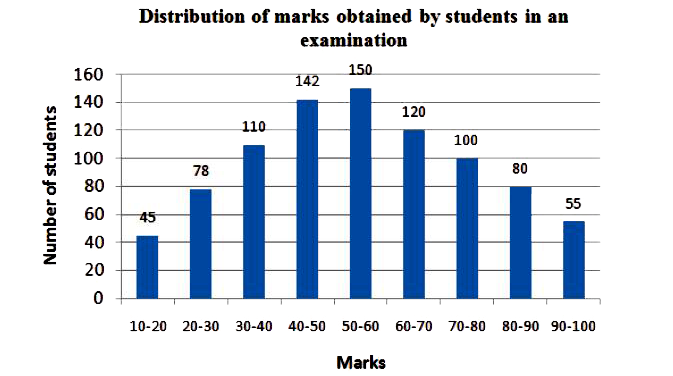
The number of students who obtained 20 marks or more but less than 60 marks is :A402B600C480D522Study the following graph carefully to answer the questions that follow-----
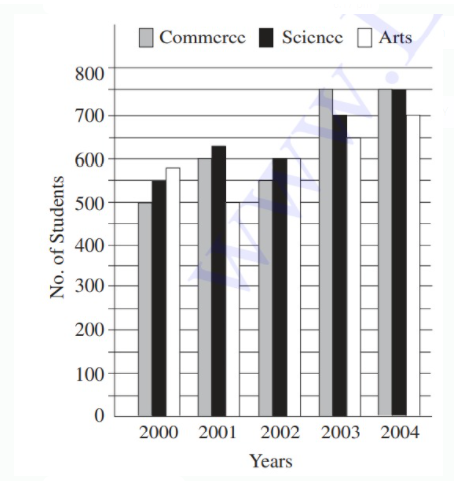
What is the total number of students studying Arts in all the years together ?A3700B2750C3500DNone of theseStudy the given graph and answer the question that follows.
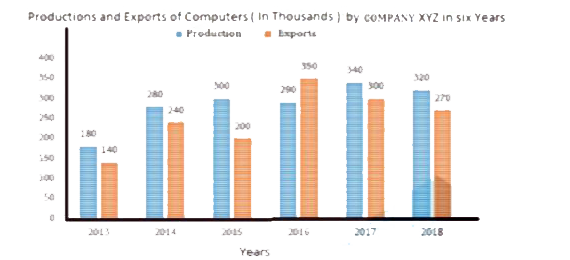
By what percent were the total exports of computers, by the company, in 2013, 2014 and 2018 less than the total production of computers in 2015 to 2017 (correct to one decimal place)?A28.8B43.1C32.6D30.1
The given bar graph represents the number of students who appeared in the board examination in session 2017-18 and 2018-19. Study the graph and answer the question that follows.
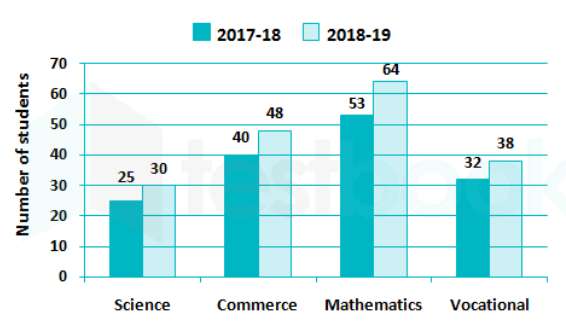
The difference between the average number of students of Science and Mathematics streams in 2017-2018 and that in Commerce and Vocational in 2018-19, is:
View SolutionStudy the graph and answer question ,
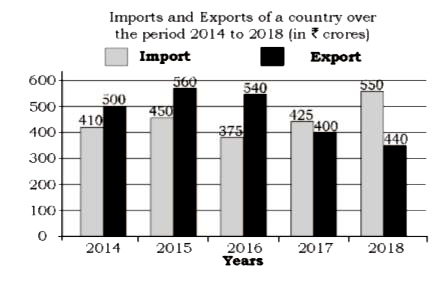
In what percentage are the total imports of the country in 2016 and 2017 less then the total exports 2014 ,2015 and 2018
View SolutionStudy the given graph and answer the question that follows
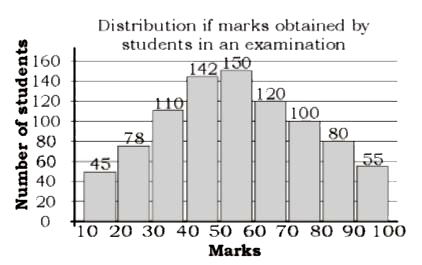
The total marks of students obtaining less than 50 marks is what percentage more than the total number of students obtaining 60 marks or more
View SolutionThe given bar graph represents the number of students who appeared in the board examination in session 2017-18 and 2018-19. Study the graph and answer the question that follows.
दिया गया दंड आरेख सत्र 2017-18 और 2018-19 सत्र में बोर्ड परीक्षा में उपस्थित होने वाले छात्रों की संख्या को दर्शाता है। आरेख का अध्ययन करें और प्रश्न का उत्तर दें। The difference between the average number of students of Science and Humanities stream in 2017-18 and that in Commerce and Vocational in 2018-19 is:
2017-18 में विज्ञान और मानविकी विषय के छात्रों की औसत संख्या और 2018-19 में वाणिज्य और व्यावसायिक में छात्रों की औसत संख्या के बीच अंतर ज्ञात करे।
View SolutionStudy the given graph and answer the question that follows
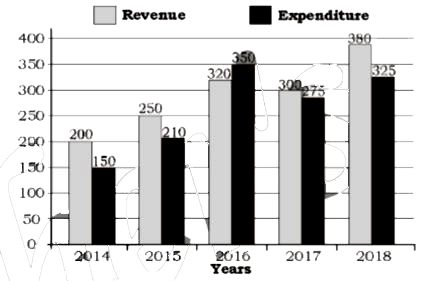
Total expenditure of the company in 2016, 2017 and 2018 is what percentage less than the total revenue in the given five years
View Solution
