The pie chart shows the investments made by 7 partners in a businees. Study the diagram and answer the following questions.
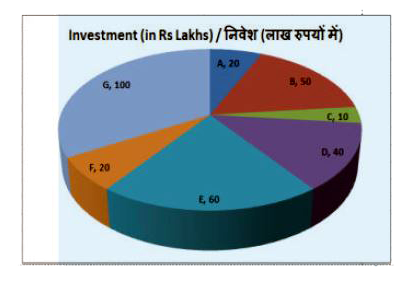
Which partner has made the second highest investment?
(a)B
(b)C
(c)D
(d)E
B
C
D
E
E
Similar Questions
The pie chart shows the investments made by 7 partners in a businees. Study the diagram and answer the following questions.
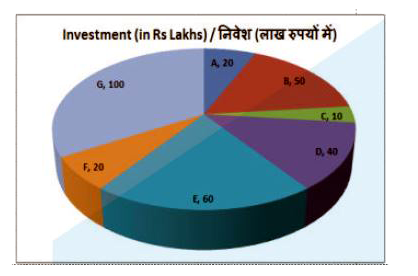
The measure of the central angle of the sector representing investment of partner E is_________degrees.
View SolutionThe pie chart shows the investments made by 7 partners in a businees. Study the diagram and answer the following questions.
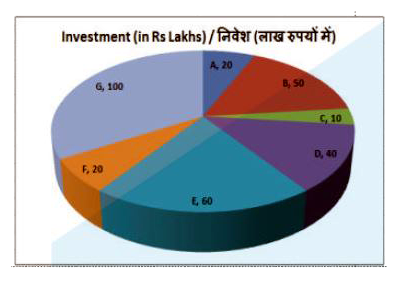
What is the total investment (in Rs lakhs) in the business?
(a)400
(b)350
(d)300
(d)250
View Solution
Knowledge Check
The pie chart shows the share in profits of the year 2017 of seven partners in a business. Study the diagram and answer the following questions.
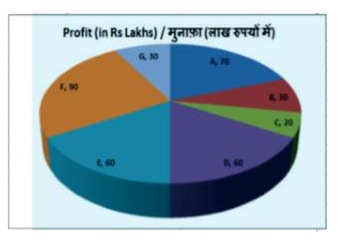
Which partner got the seocnd higheset share in profits ?ACBACEDFThe bar graph shows the population of different countries. Study the diagram and answer the following questions.
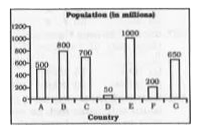
Which country has the second highest population?ABBDCEDAThe pie chart graphs shows the number of seats that each party has in the lower house of the parliament. Study the diagram and answer the following questions.
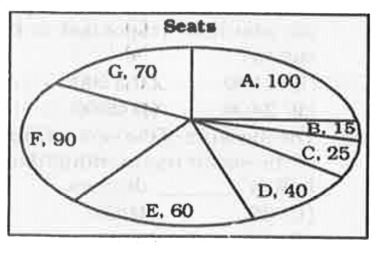
Which party has the second highest seats?AFBGCADD
The pie chart shows the investments made by 7 partners in a businees. Study the diagram and answer the following questions.
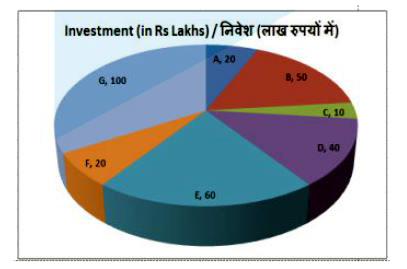
If the business makes Rs 45 lakh profit which is distributed between the partners how much does C get (in Rs lakhs)?
View SolutionDirection The pie chart shows the shares of 6 partners in certain company. Study the diagram and answer the following questions.
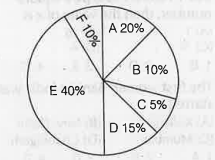 Which partner has the lowest share? (A)C (B) B (C) D (D) F
View SolutionThe pie-chart shows the breakup in percent age of the various expenses of a Company. Study the diagram and answer the following questions.
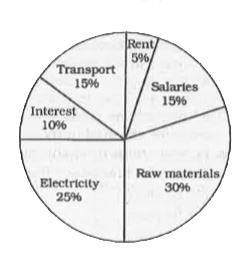
Which is the second biggest expense of the company?
View SolutionThe bar graph shows the annual sales of the different departments of a company. Study the diagram and answer the following questions.
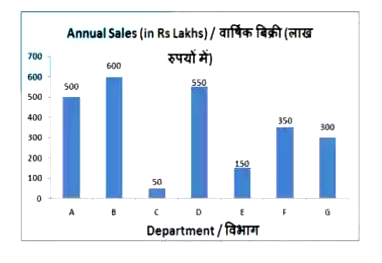
Which department has the second highest annual sales?
View SolutionThe pie chart shows the share in profits of the year 2017 of seven partners in a business. Study the digram and answer the following questions.
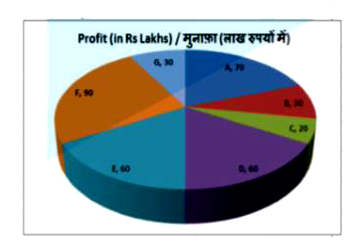
The measure of the central angle of the sector representing share in profits of partner E is ________ degrees.
View Solution
