The pie chart shows the investments made by 7 partners in a businees. Study the diagram and answer the following questions.
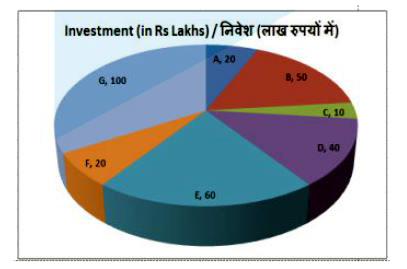
If the business makes Rs 45 lakh profit which is distributed between the partners how much does C get (in Rs lakhs)?
3
2
1.5
2.5
1.5
Similar Questions
The pie chart shows the investments made by 7 partners in a businees. Study the diagram and answer the following questions.
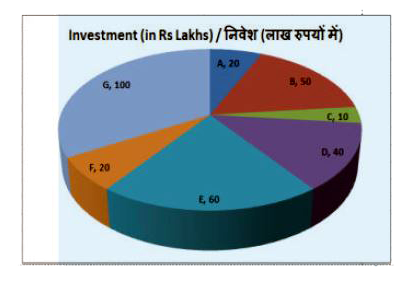
Which partner has made the second highest investment?
(a)B
(b)C
(c)D
(d)EView SolutionThe pie chart shows the investments made by 7 partners in a businees. Study the diagram and answer the following questions.
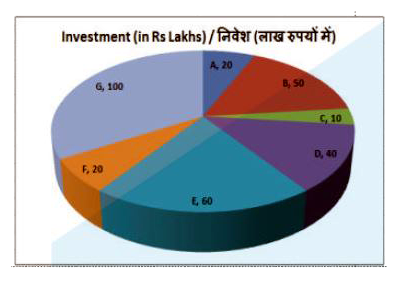
What is the total investment (in Rs lakhs) in the business?
(a)400
(b)350
(d)300
(d)250View Solution
Knowledge Check
- Question 1 - Select One
The pie chart shows the share in profits of the year 2017 of seven partners in a business. Study the digram and answer the following questions.
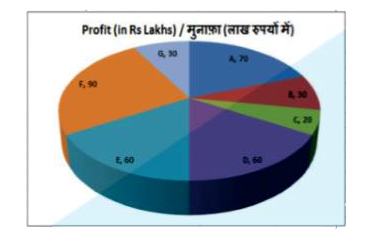
If the business makes Rs 45 lakh profit which is distributed between the partners how much does C get (in Rs lakhs) ?A3B2.5C4D2 - Question 2 - Select One
The pie chart shows the share in profits of the year 2017 of seven partners in a business. Study the diagram and answer the following questions.
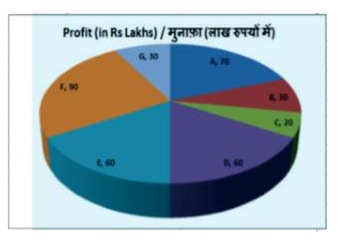
Which partner got the seocnd higheset share in profits ?ACBACEDF - Question 3 - Select One
The pie chart shows the share in profits of the year 2017 of seven partners in a business. Study the diagram and answer the following questions.
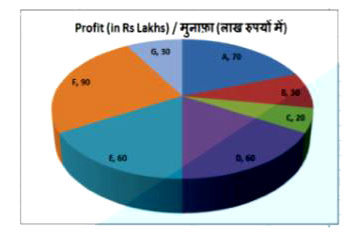
What is the total Profit (in rs lakhs) of the business of the year 2017 ?
(a)400
(b)300
(c)360
(d)350A400B300C360D350
The pie chart shows the investments made by 7 partners in a businees. Study the diagram and answer the following questions.
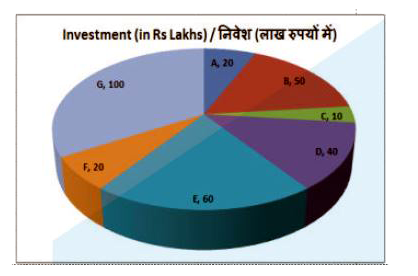
The measure of the central angle of the sector representing investment of partner E is_________degrees.View SolutionDirection The pie chart shows the shares of 6 partners in certain company. Study the diagram and answer the following questions.
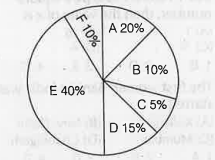 Which partner has the lowest share? (A)C (B) B (C) D (D) F View Solution
The line graph shows the exports by a certain company. Study the diagram and answer the following questions.
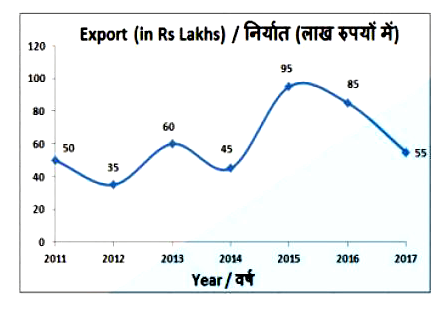
What were the total exports (in Rs lakhs) by the company in the last four years?View SolutionThe pie chart shows the share in profits of the year 2017 of seven partners in a business. Study the digram and answer the following questions.
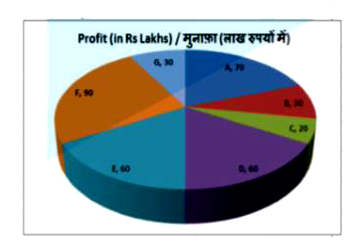
The measure of the central angle of the sector representing share in profits of partner E is ________ degrees.View SolutionThe pie chart shows the breakup of expenditure of a college for the year 2017. Study the diagram and answer the following questions.
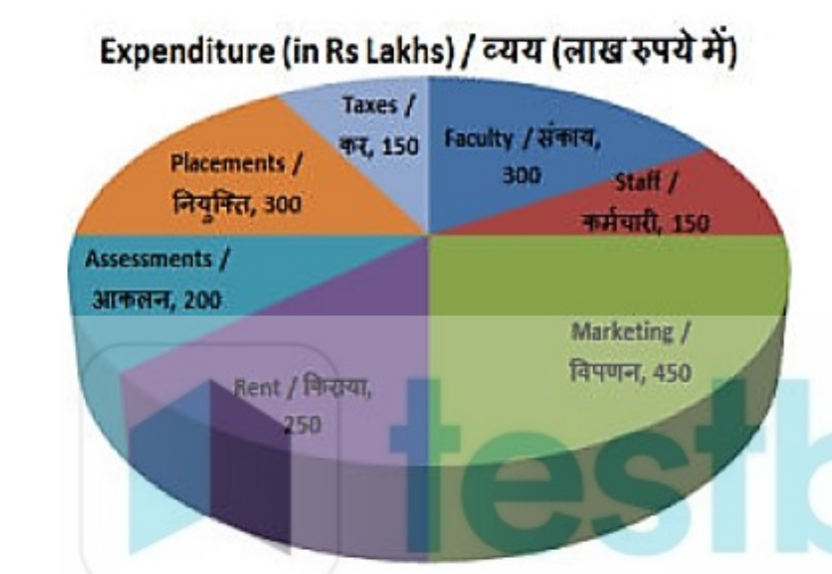
What is the total expenditure (in Rs lakhs)?View Solution

