Find the ratio of total sales in the two years of Company C2 and the ratio of total sales in both years of Company C4?
9:8
7:9
7:3
5:6
The correct Answer is:B
To solve the problem of finding the ratio of total sales in the two years of Company C2 and the ratio of total sales in both years of Company C4, we can follow these steps:
Step 1: Identify Sales Data
First, we need to gather the sales data for Company C2 and Company C4 for the years 2020 and 2021.
Assuming the sales data from the graph or table is as follows:
- C2 Sales:
- 2020: 75 (in thousands)
- 2021: 85 (in thousands)
- C4 Sales:
- 2020: 95 (in thousands)
- 2021: 105 (in thousands)
Step 2: Calculate Total Sales for Company C2
Next, we calculate the total sales for Company C2 over the two years:
Total Sales of C2=Sales in 2020+Sales in 2021=75+85=160 (in thousands)
Step 3: Calculate Total Sales for Company C4
Now, we calculate the total sales for Company C4 over the two years:
Total Sales of C4=Sales in 2020+Sales in 2021=95+105=200 (in thousands)
Step 4: Find the Ratio of Total Sales
Now, we can find the ratio of total sales between Company C2 and Company C4:
Ratio of Total Sales (C2 : C4)=Total Sales of C2Total Sales of C4=160200
Step 5: Simplify the Ratio
To simplify the ratio, we divide both the numerator and the denominator by their greatest common divisor (GCD), which is 40:
160÷40200÷40=45
Final Answer
The ratio of total sales in the two years of Company C2 to the total sales in both years of Company C4 is:
Ratio (C2 : C4)=4:5
---
First, we need to gather the sales data for Company C2 and Company C4 for the years 2020 and 2021.
- C2 Sales:
- 2020: 75 (in thousands)
- 2021: 85 (in thousands)
- 2020: 95 (in thousands)
- 2021: 105 (in thousands)
Next, we calculate the total sales for Company C2 over the two years:
Total Sales of C2=Sales in 2020+Sales in 2021=75+85=160 (in thousands)
Now, we calculate the total sales for Company C4 over the two years:
Total Sales of C4=Sales in 2020+Sales in 2021=95+105=200 (in thousands)
Now, we can find the ratio of total sales between Company C2 and Company C4:
Ratio of Total Sales (C2 : C4)=Total Sales of C2Total Sales of C4=160200
To simplify the ratio, we divide both the numerator and the denominator by their greatest common divisor (GCD), which is 40:
160÷40200÷40=45
The ratio of total sales in the two years of Company C2 to the total sales in both years of Company C4 is:
Ratio (C2 : C4)=4:5
Similar Questions
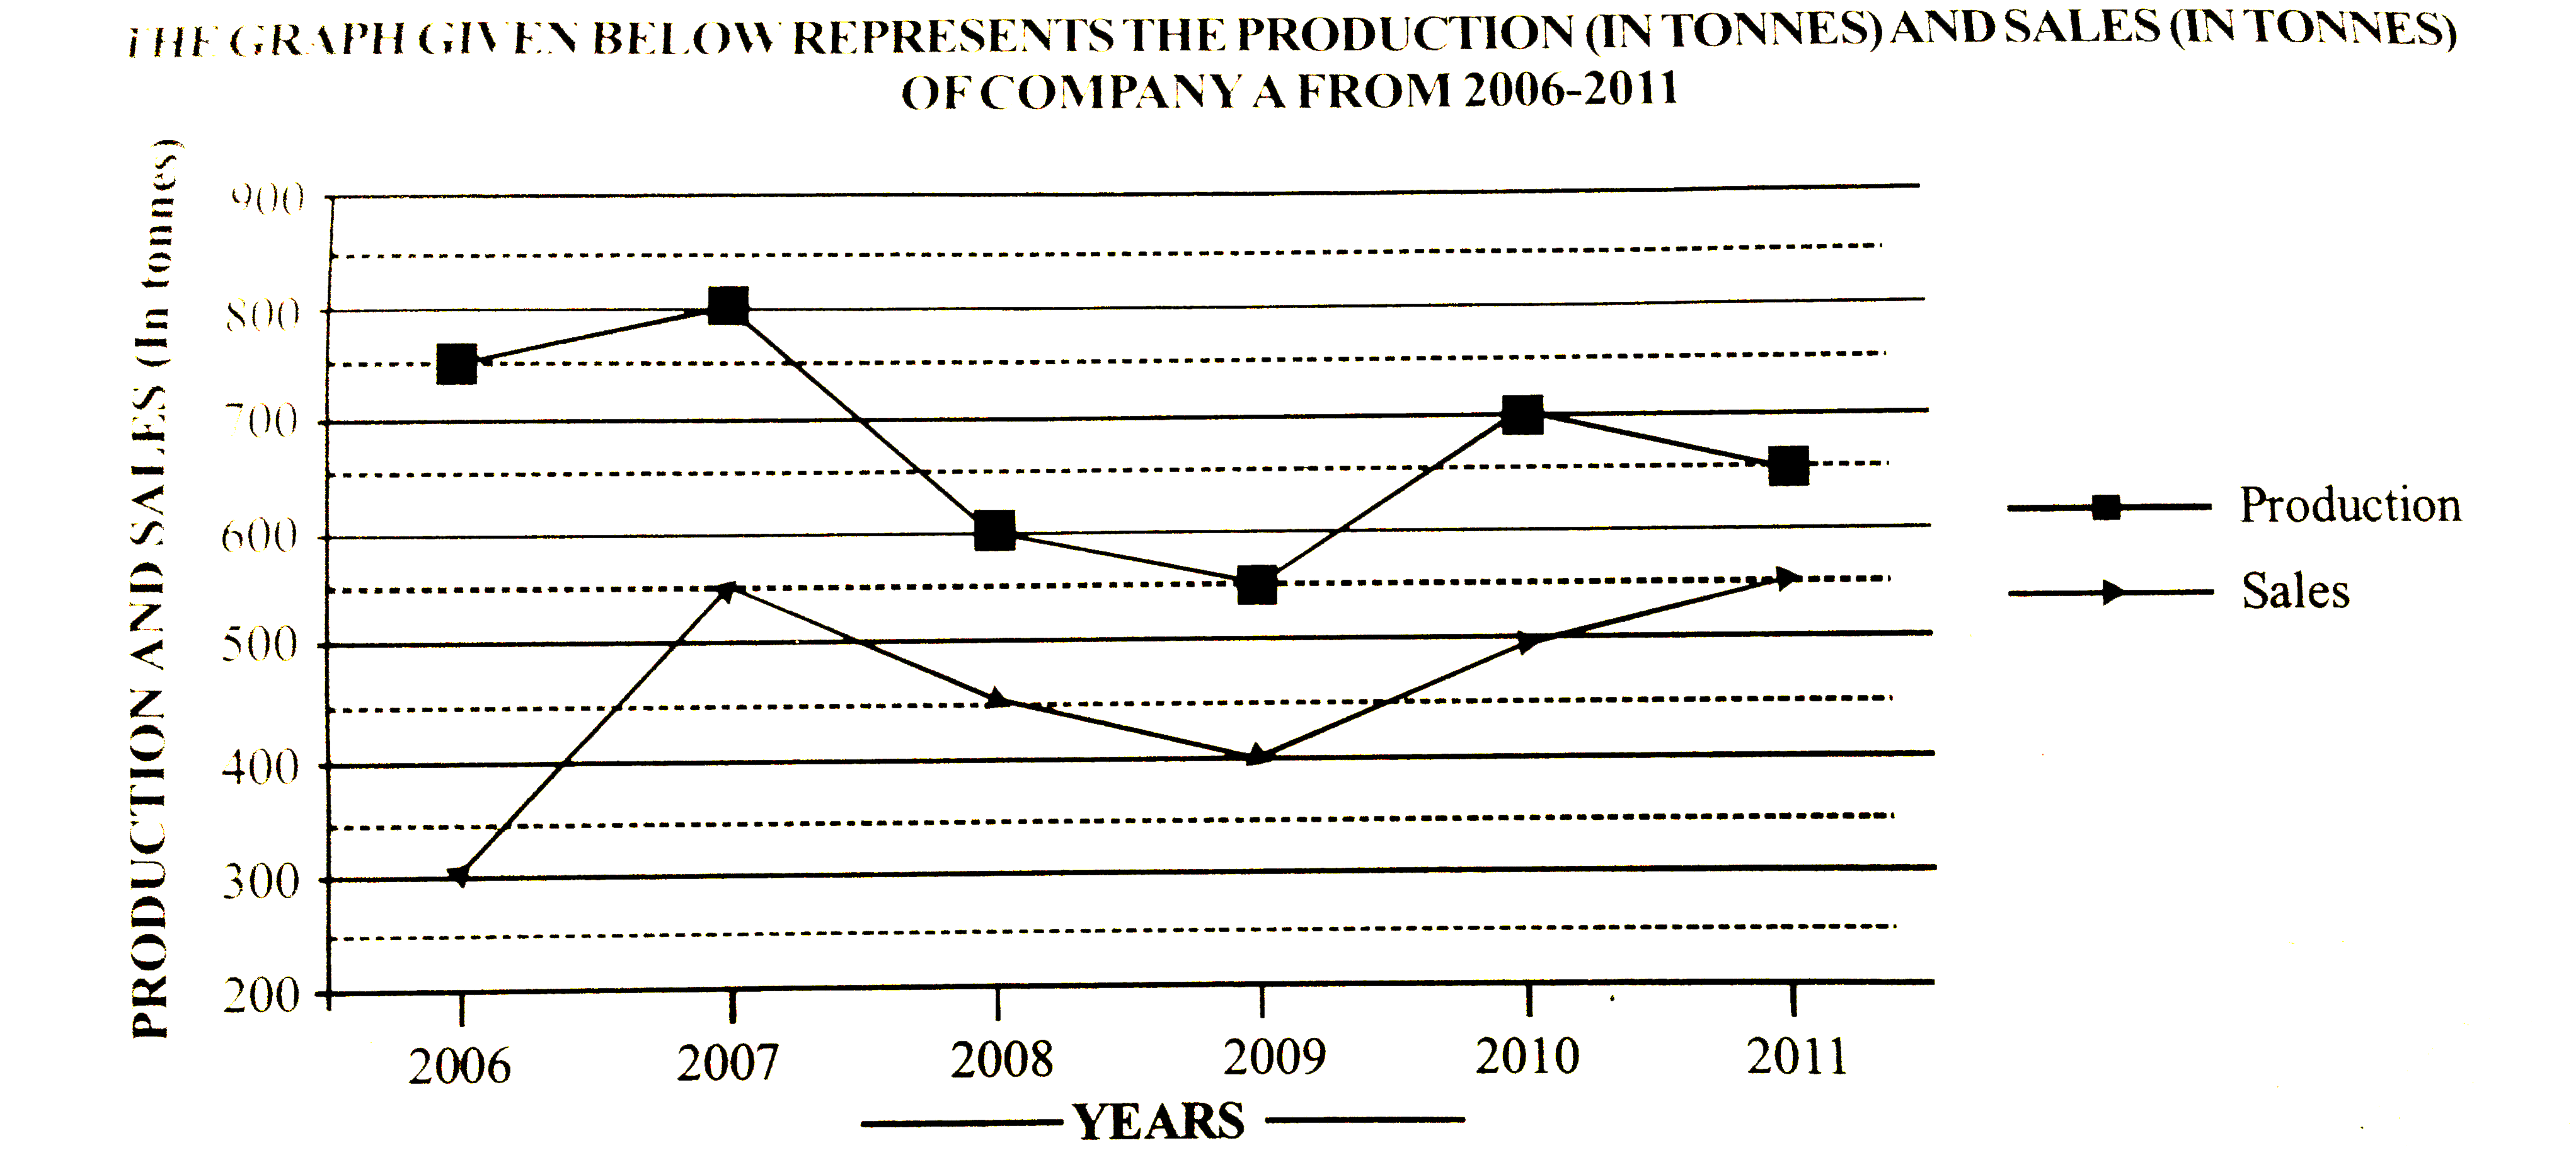
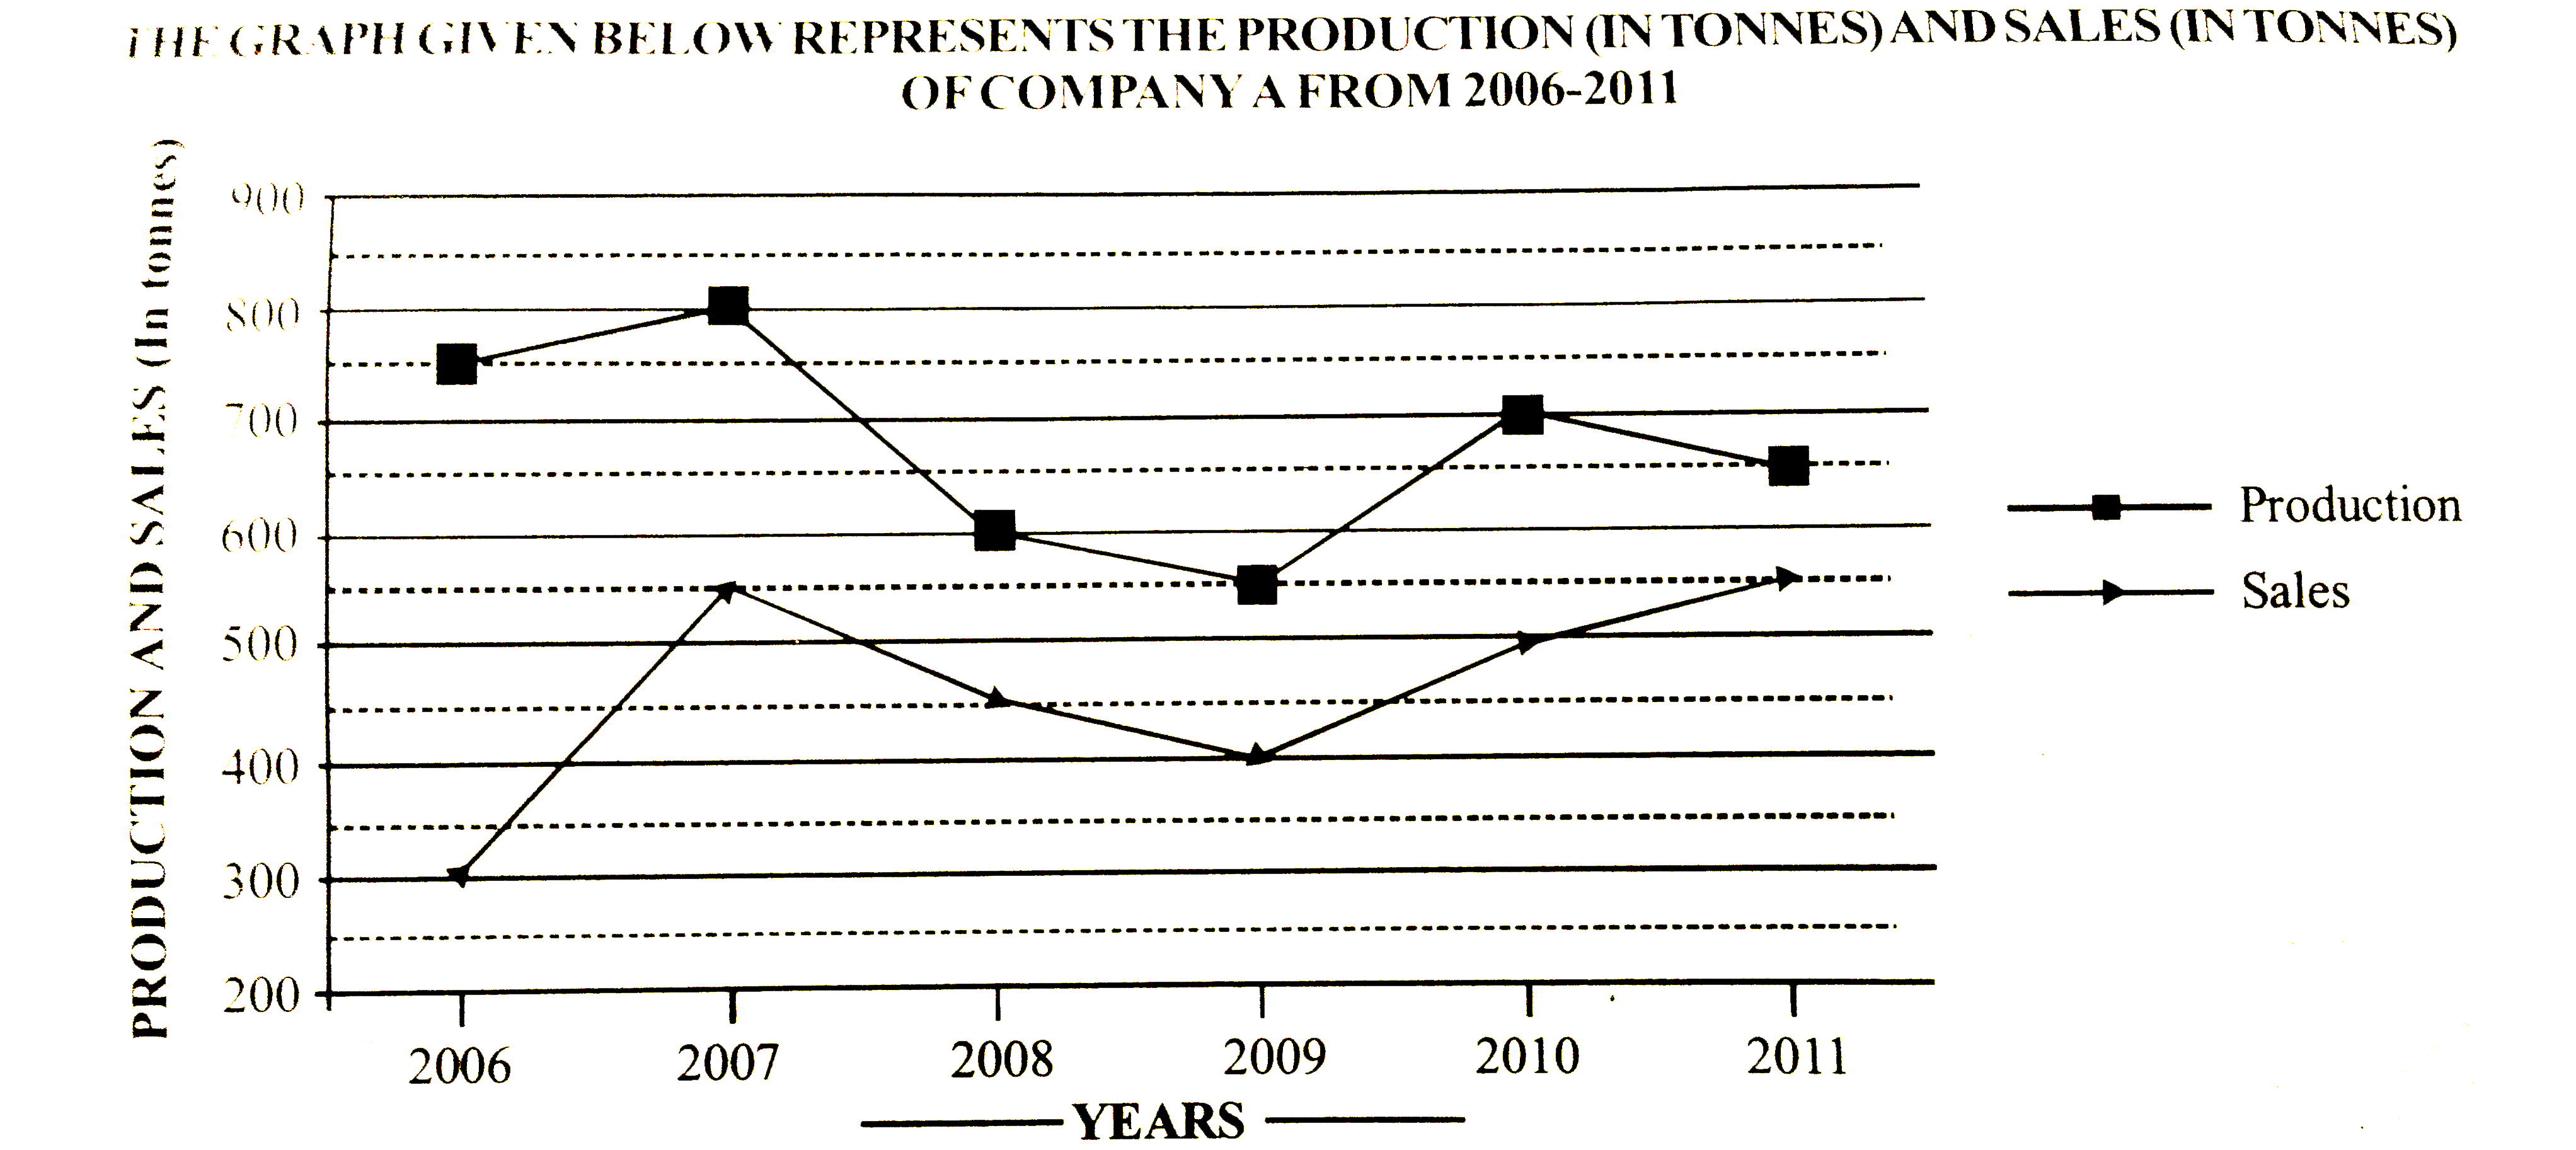
The table given below represents the respective ratio of the production (in tonners) of Company A to the production (in tonnes) of Company B, and the respective ratio of the sales (in tonnes )of Company A to the sales (in tonnes) of Company. B.
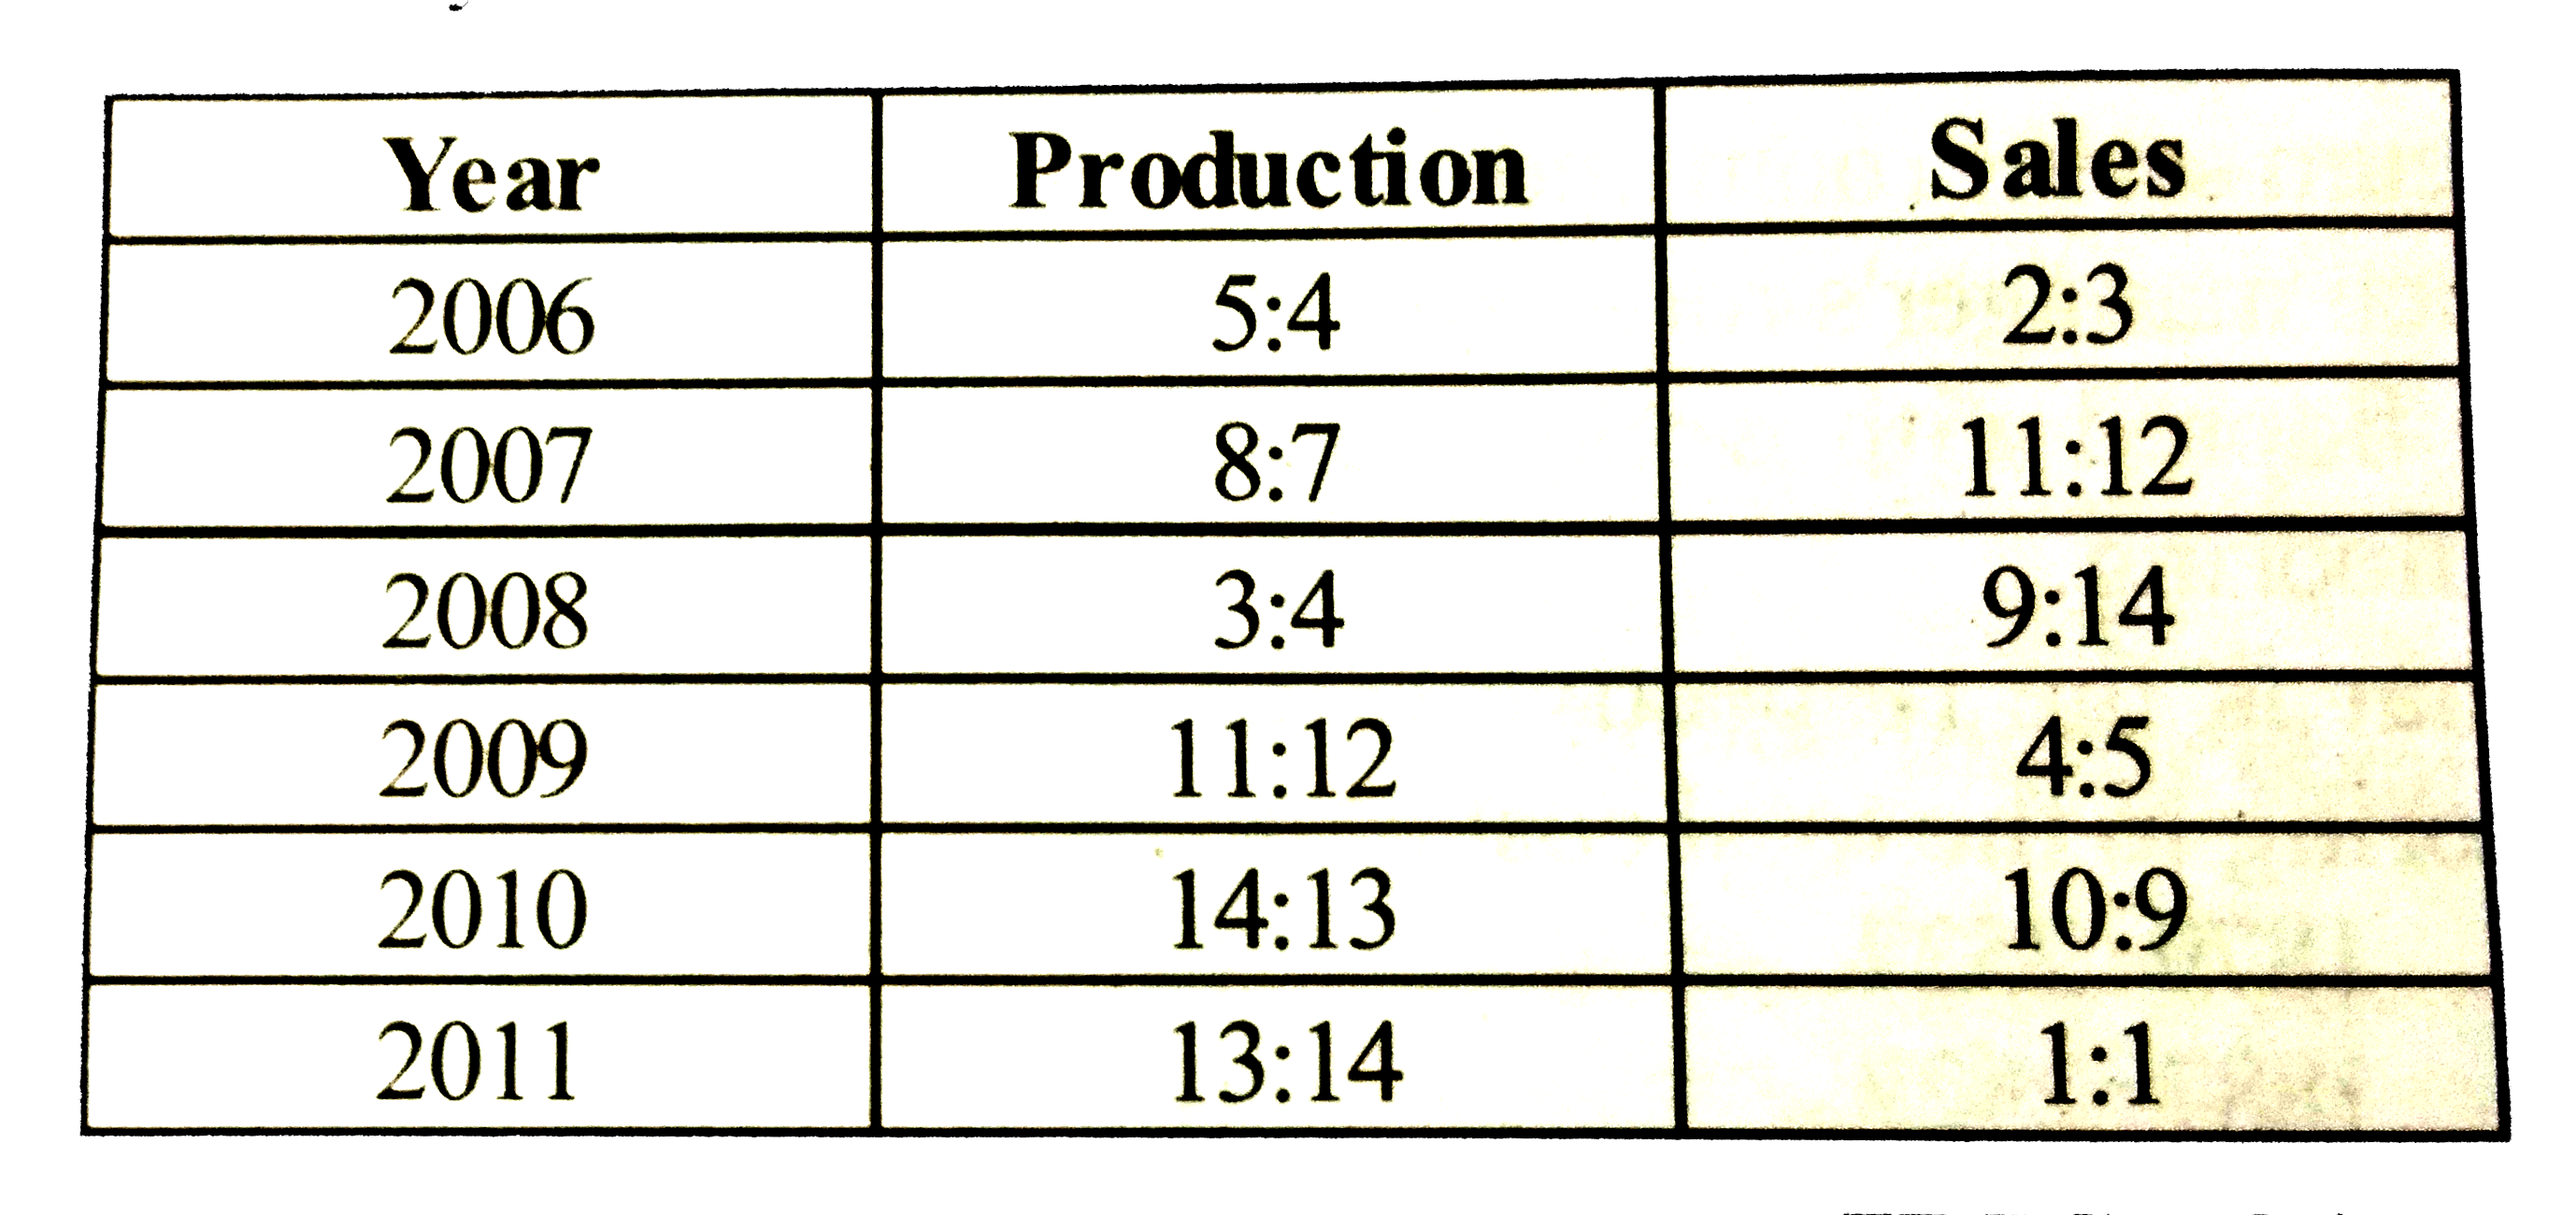
What is the respective ratio of the total production (in tonnes) of Company A to the total sales (in tonnes) of Company A?View Solution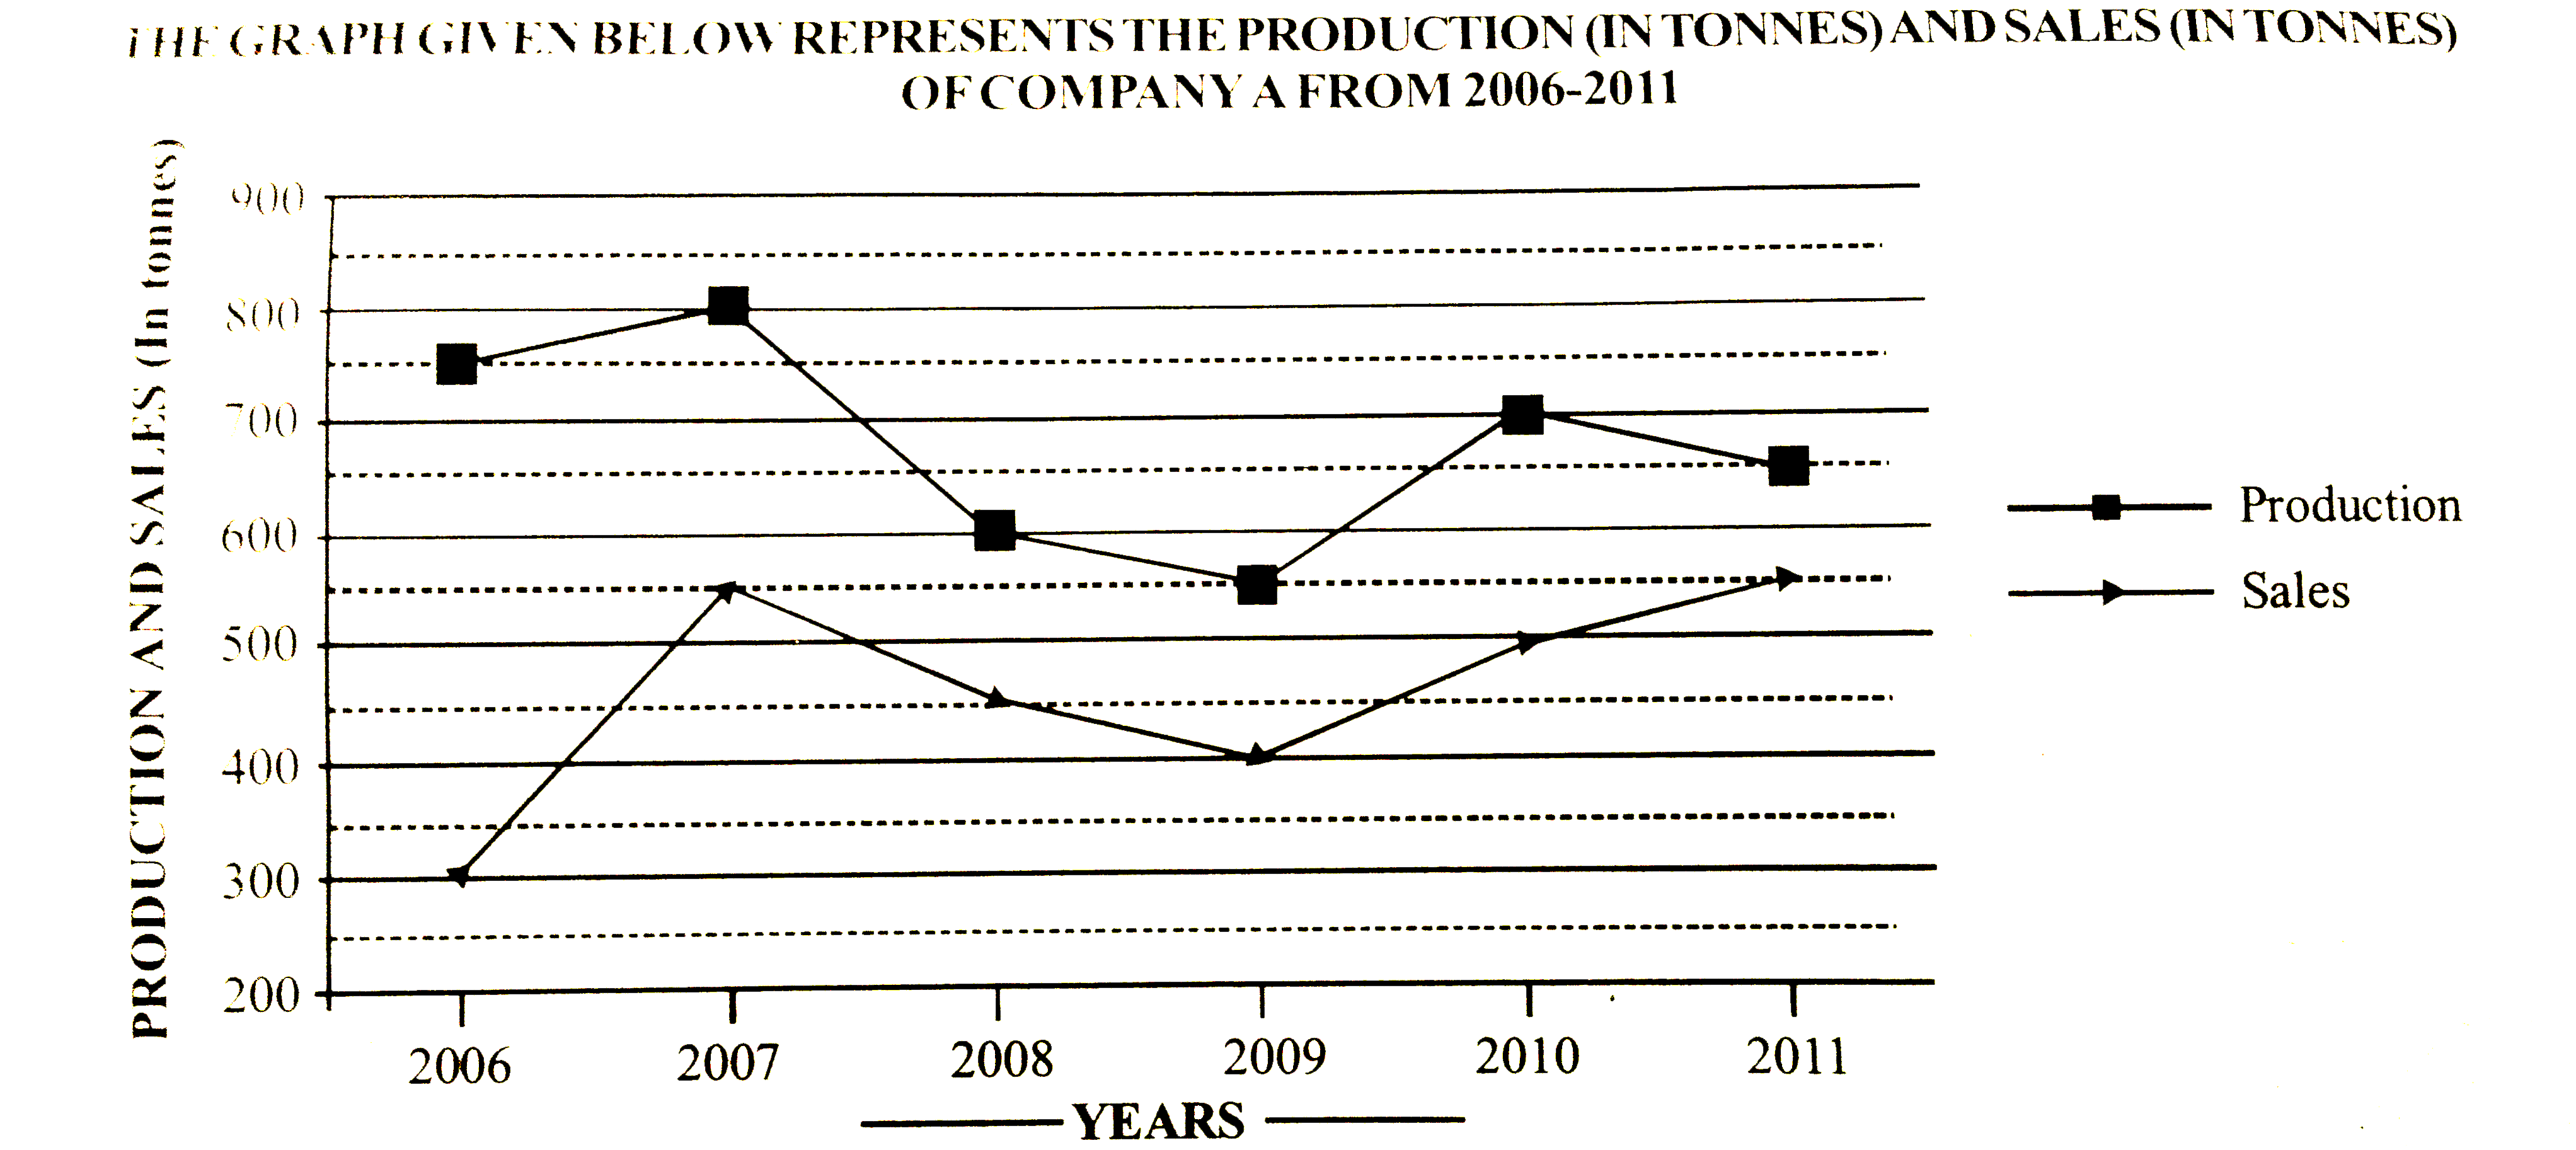
The table given below represents the respective ratio of the production (in tonnes) of Company A to the production (in tonnes) of Company B, and the respective ratio of the sales (in tonnes )of Company A to the sales (in tonnes) of Company. B.
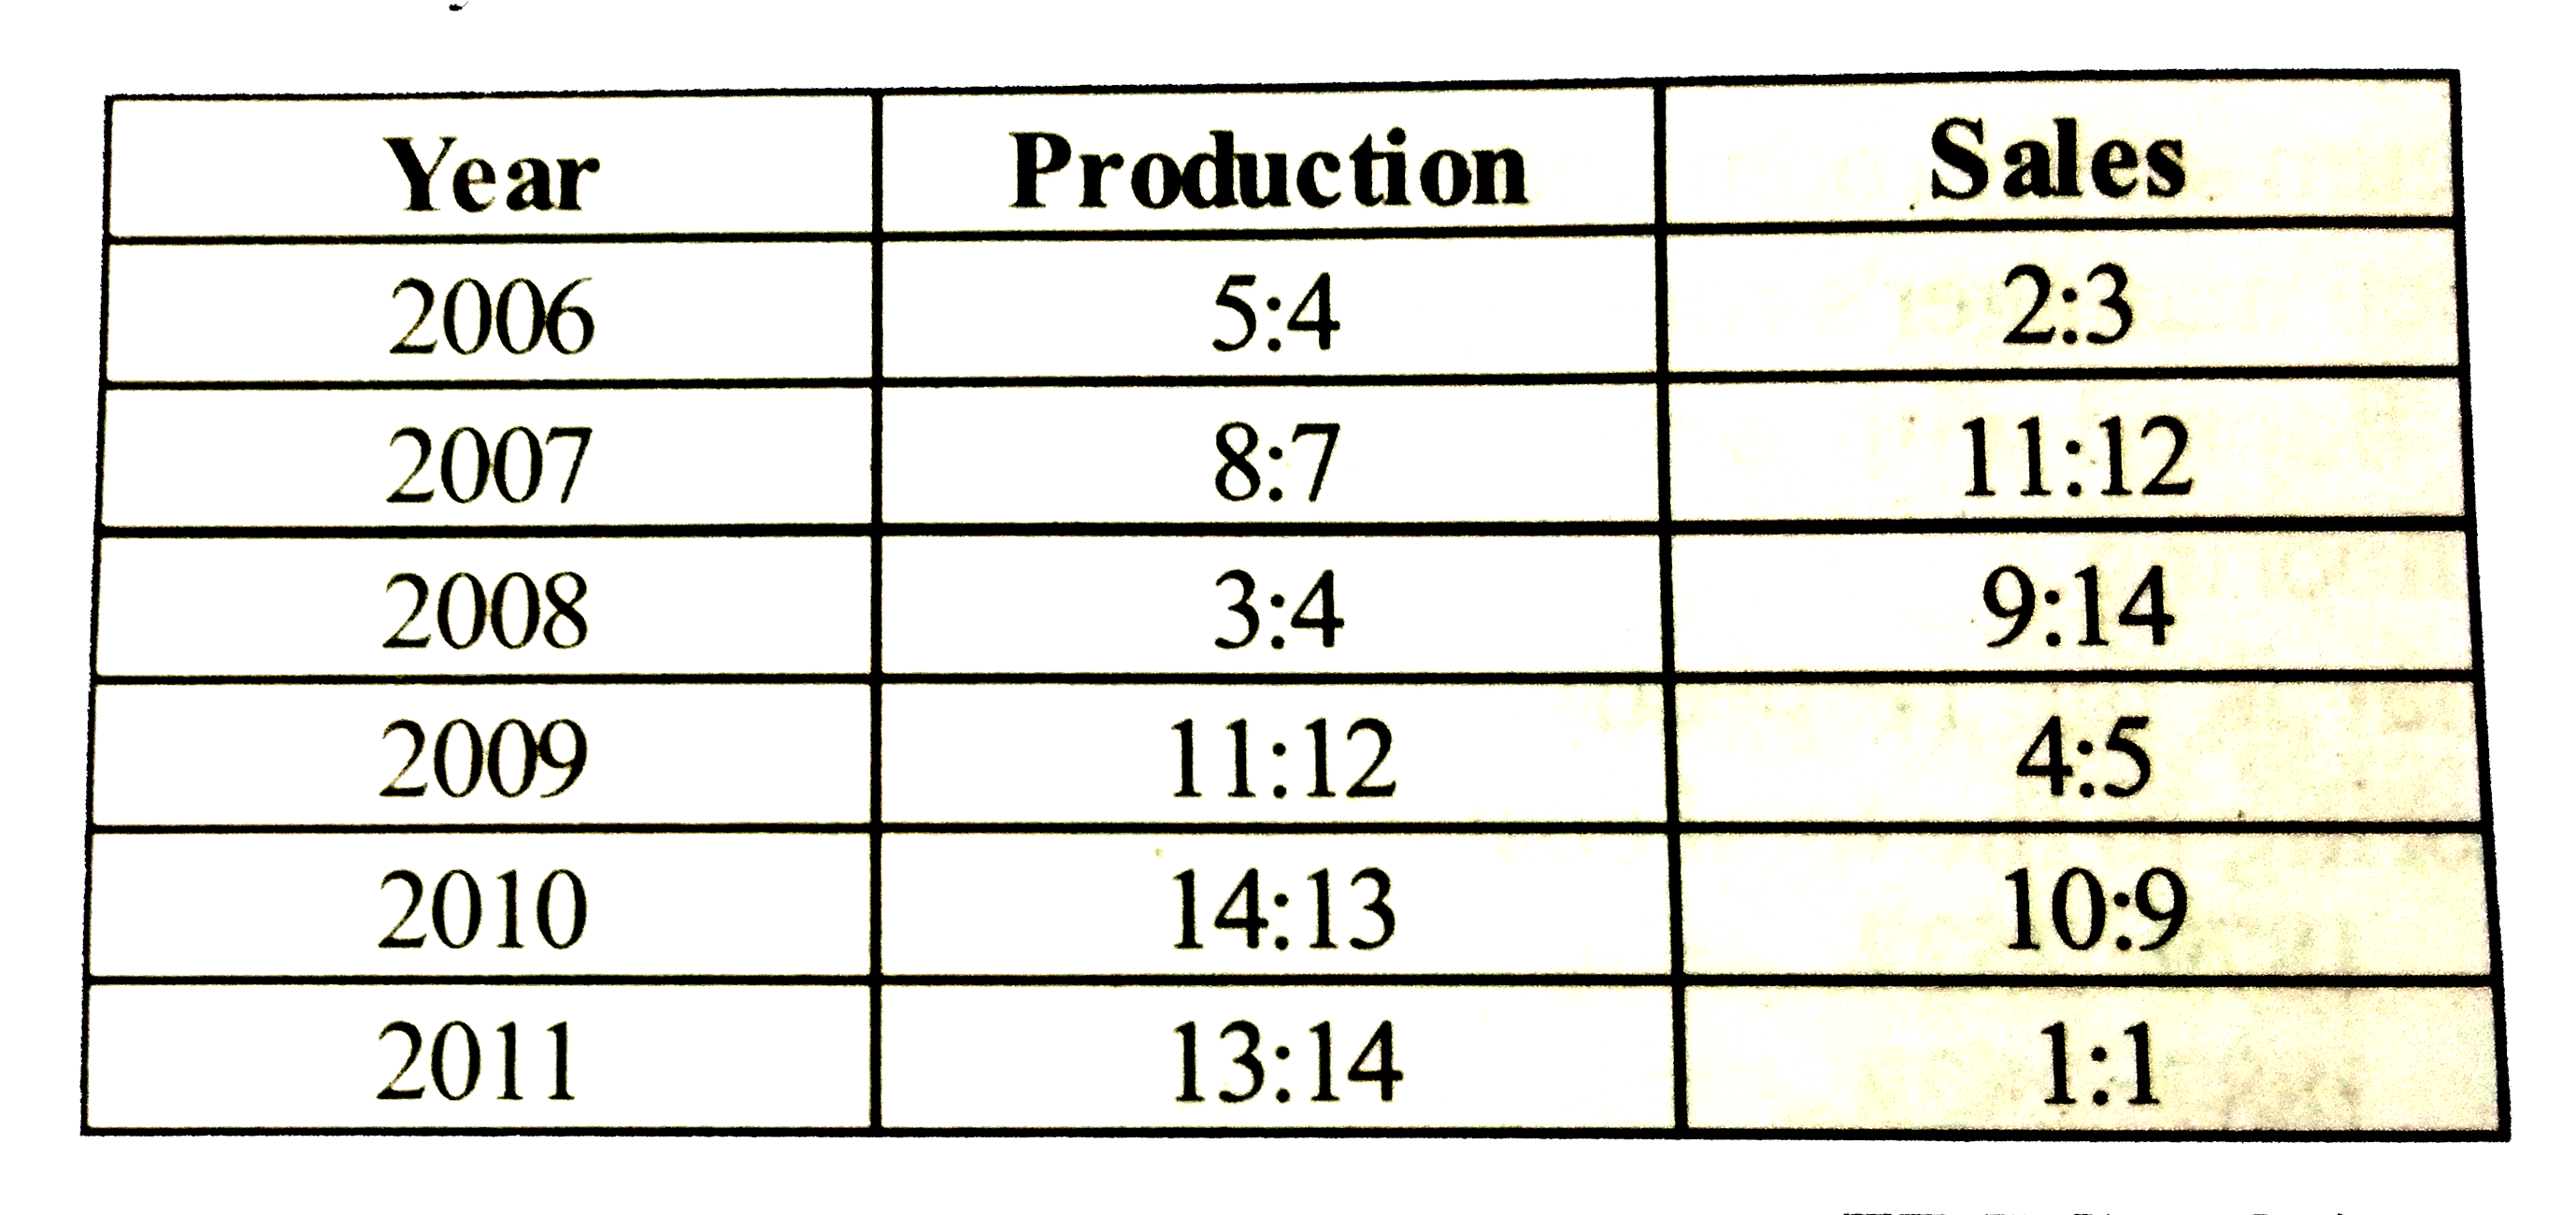
The sales of Company A in the year 2009 was approximately what percent of the production of Company A in the same year ?View Solution
Knowledge Check
- Question 1 - Select One
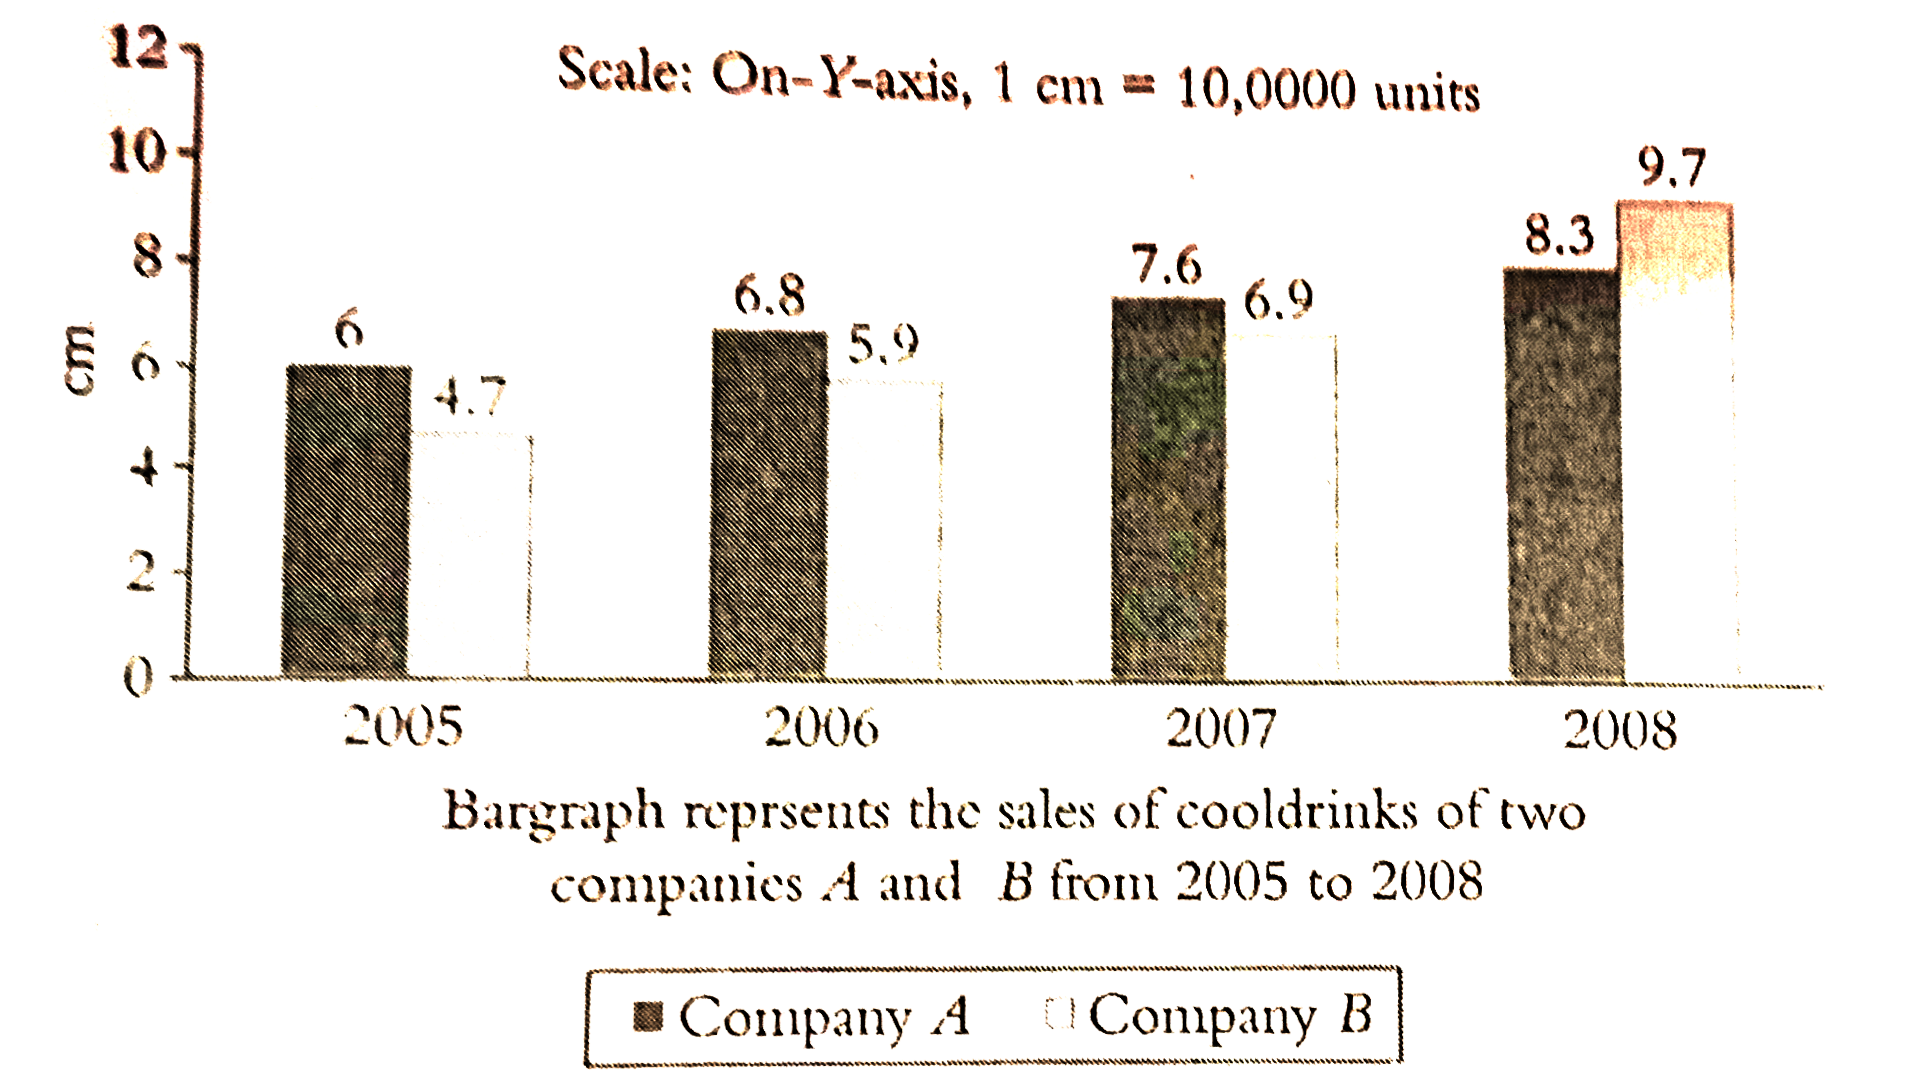
Find the ratio of the total sales in the year 2007 and that in 2008.A107:145B127:145C29:36D107:127 - Question 2 - Select One
Find out the total sales (in thousand) of company C1, C3 and C5 together in two years?
A800B560C808D888 - Question 3 - Select One
Bar-chart showing the Sales of Books (in 1000) from six-branches B1,B2,B3,B4,B5andB6 of a Publishing Company in 2000 and 2001 is given below. Study the chart and answer the questions.
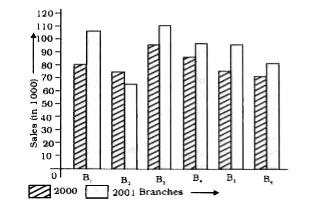
What is the ratio of the total sales of branch B2 for both the years to the total sales of branch B4 for both years ?A2:3B3:5C5:7D7:9
The table given below represents the respective ratio of the production (in tonners) of Company A to the production (in tonnes) of Company B, and the respective ratio of the sales (in tonnes )of Company A to the sales (in tonnes) of Company. B.
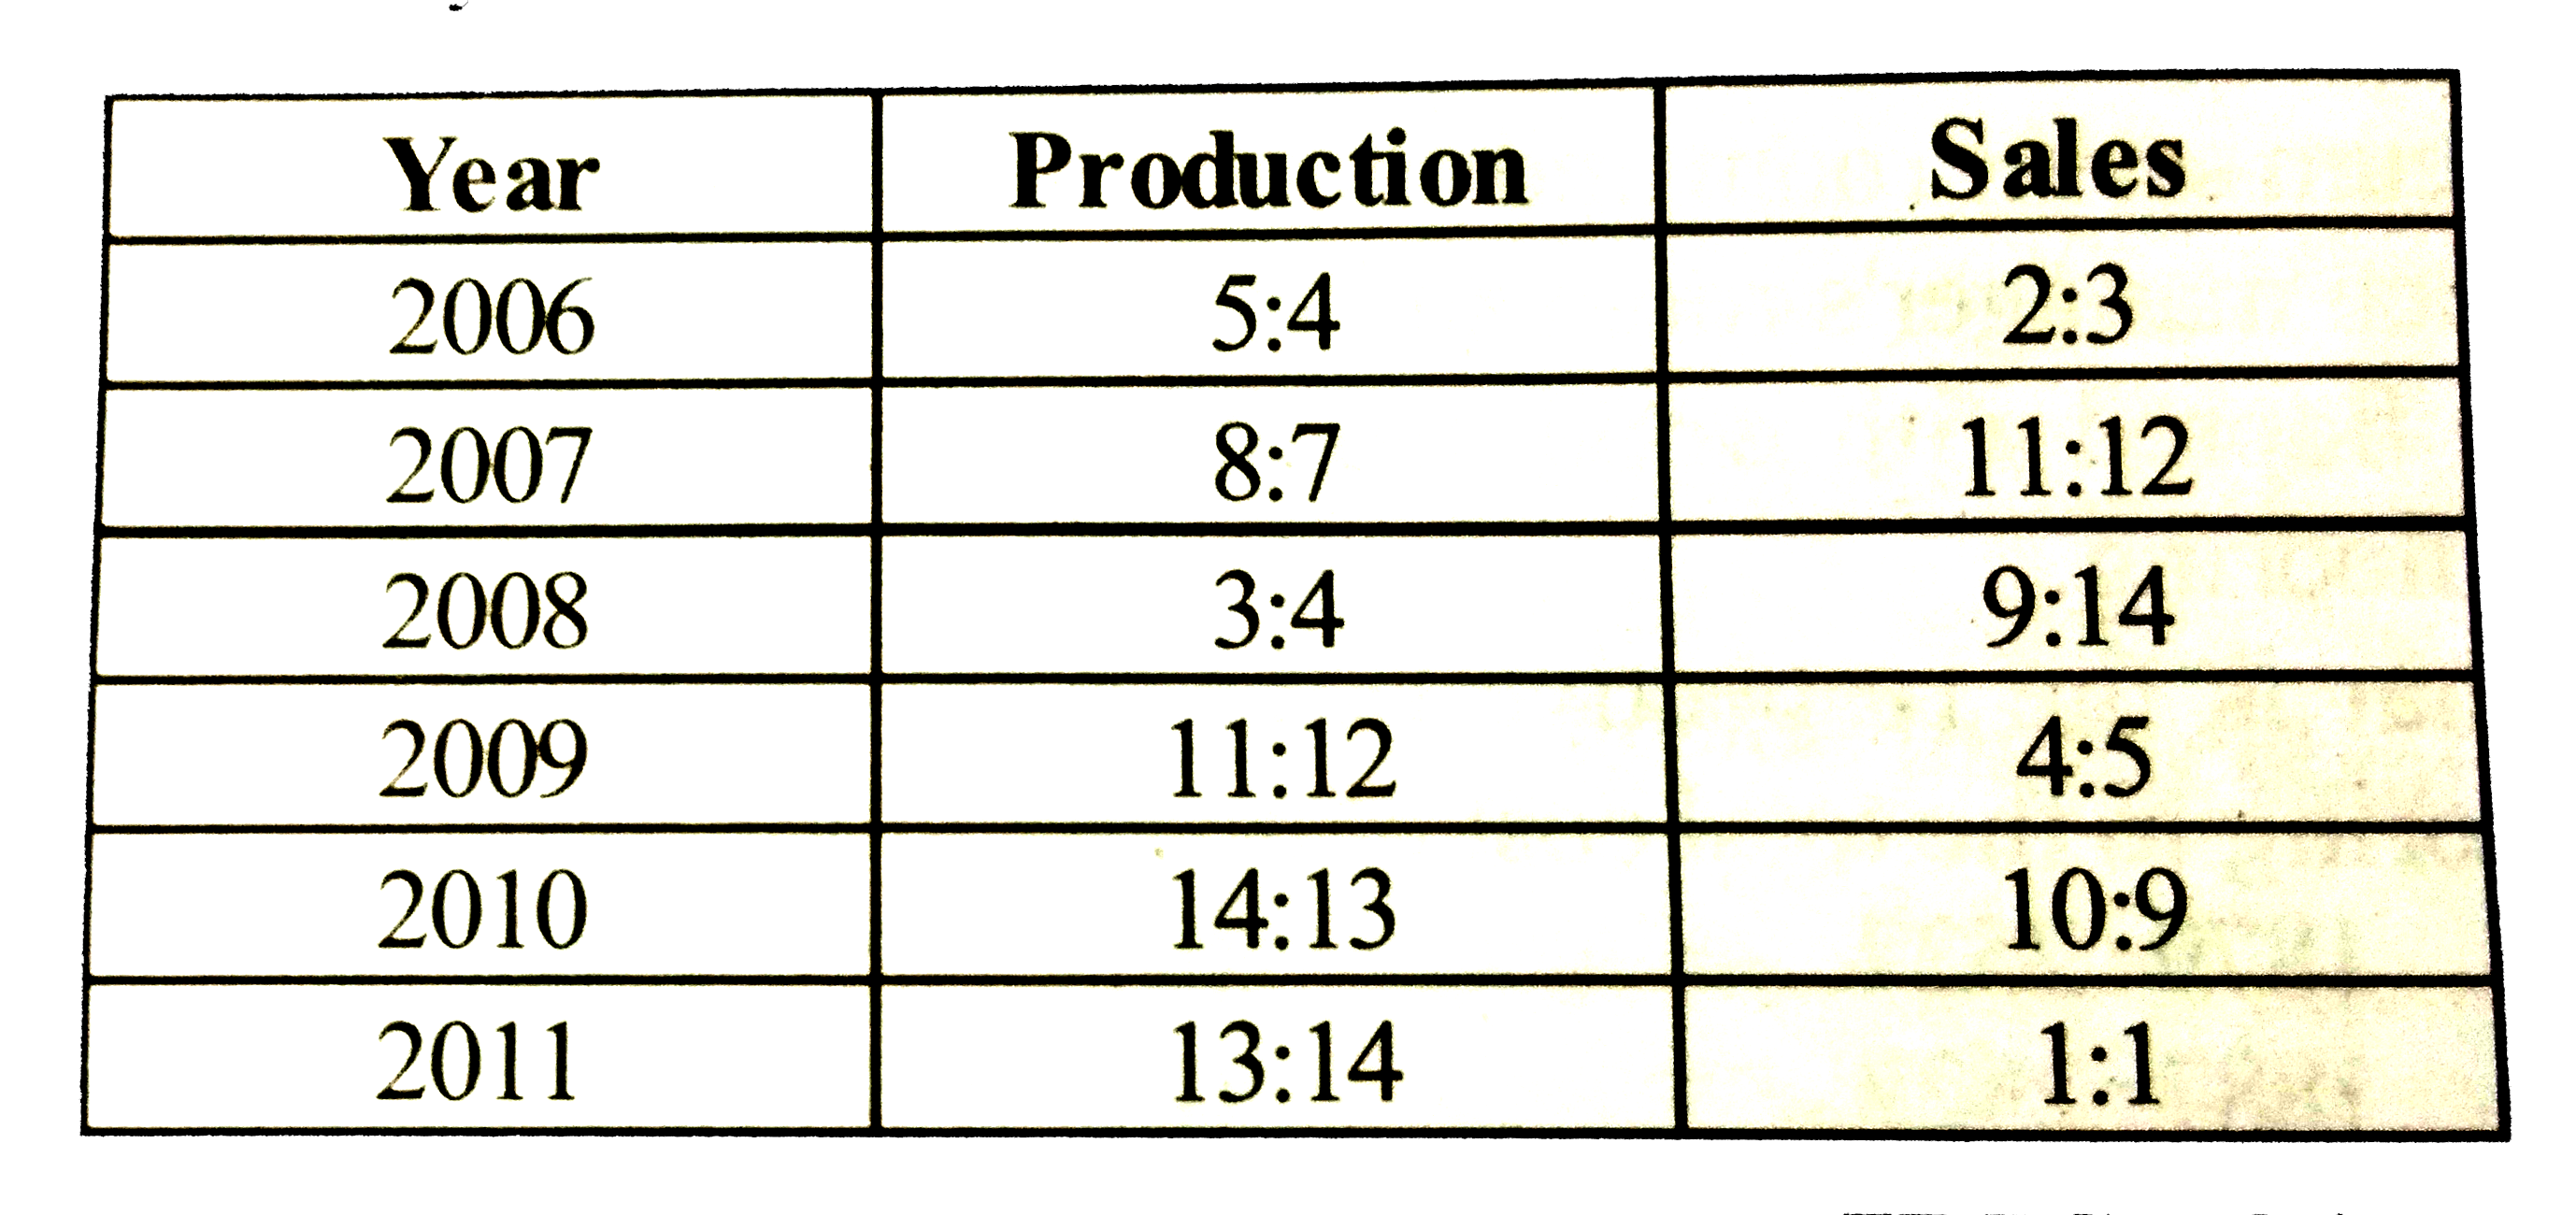
What is the respective ratio of production of Company B (in tonnes) in the year 2006 to production of Company B (in tonnes) in the year 2008?View Solution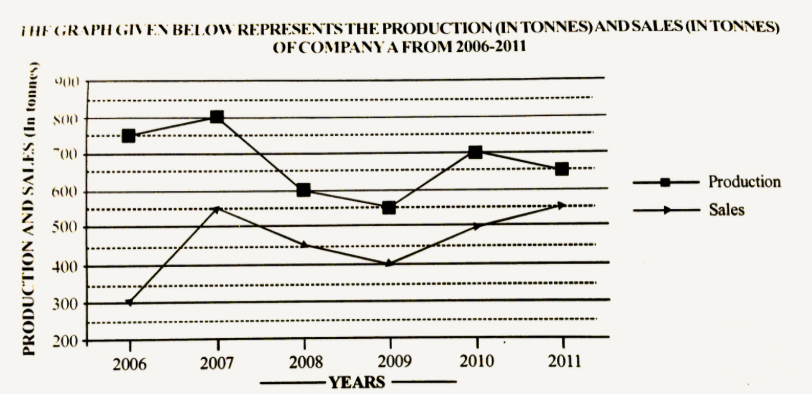
The table given below represents the respective ratio of the production (in tonners) of Company A to the production (in tonnes) of Company B, and the respective ratio of the sales (in tonnes )of Company A to the sales (in tonnes) of Company. B.
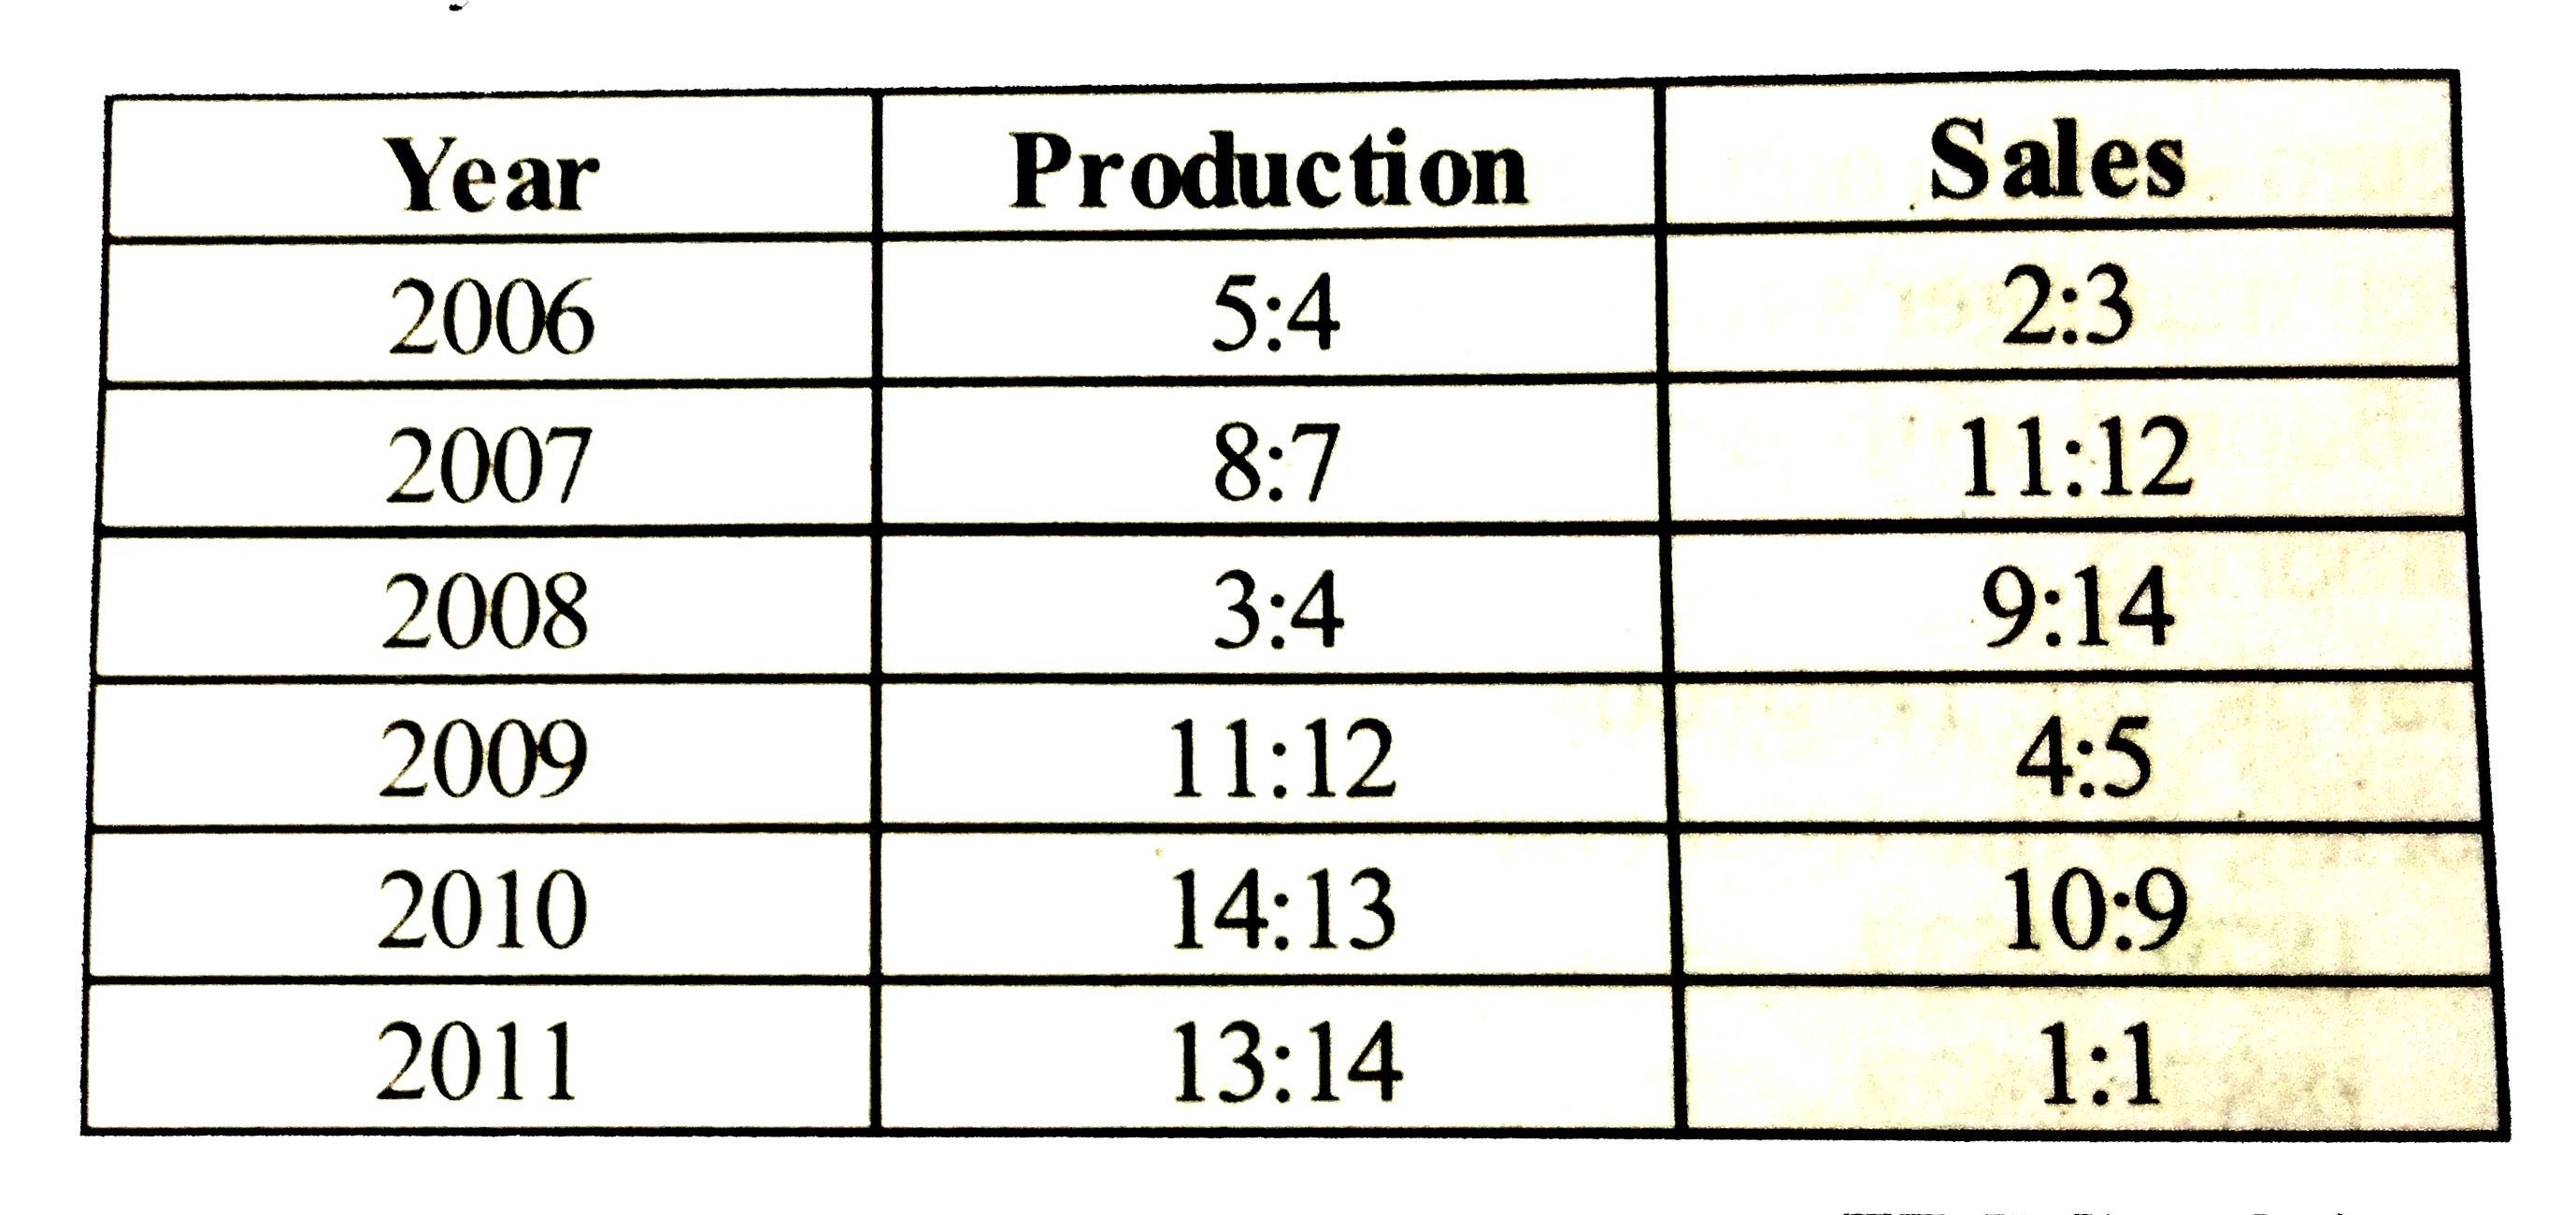
What is teh approximate perentage increases in the production of Company A(in tonnes) from the year 2009 to the production of Company A(in tonnes) in the year 2010?View Solution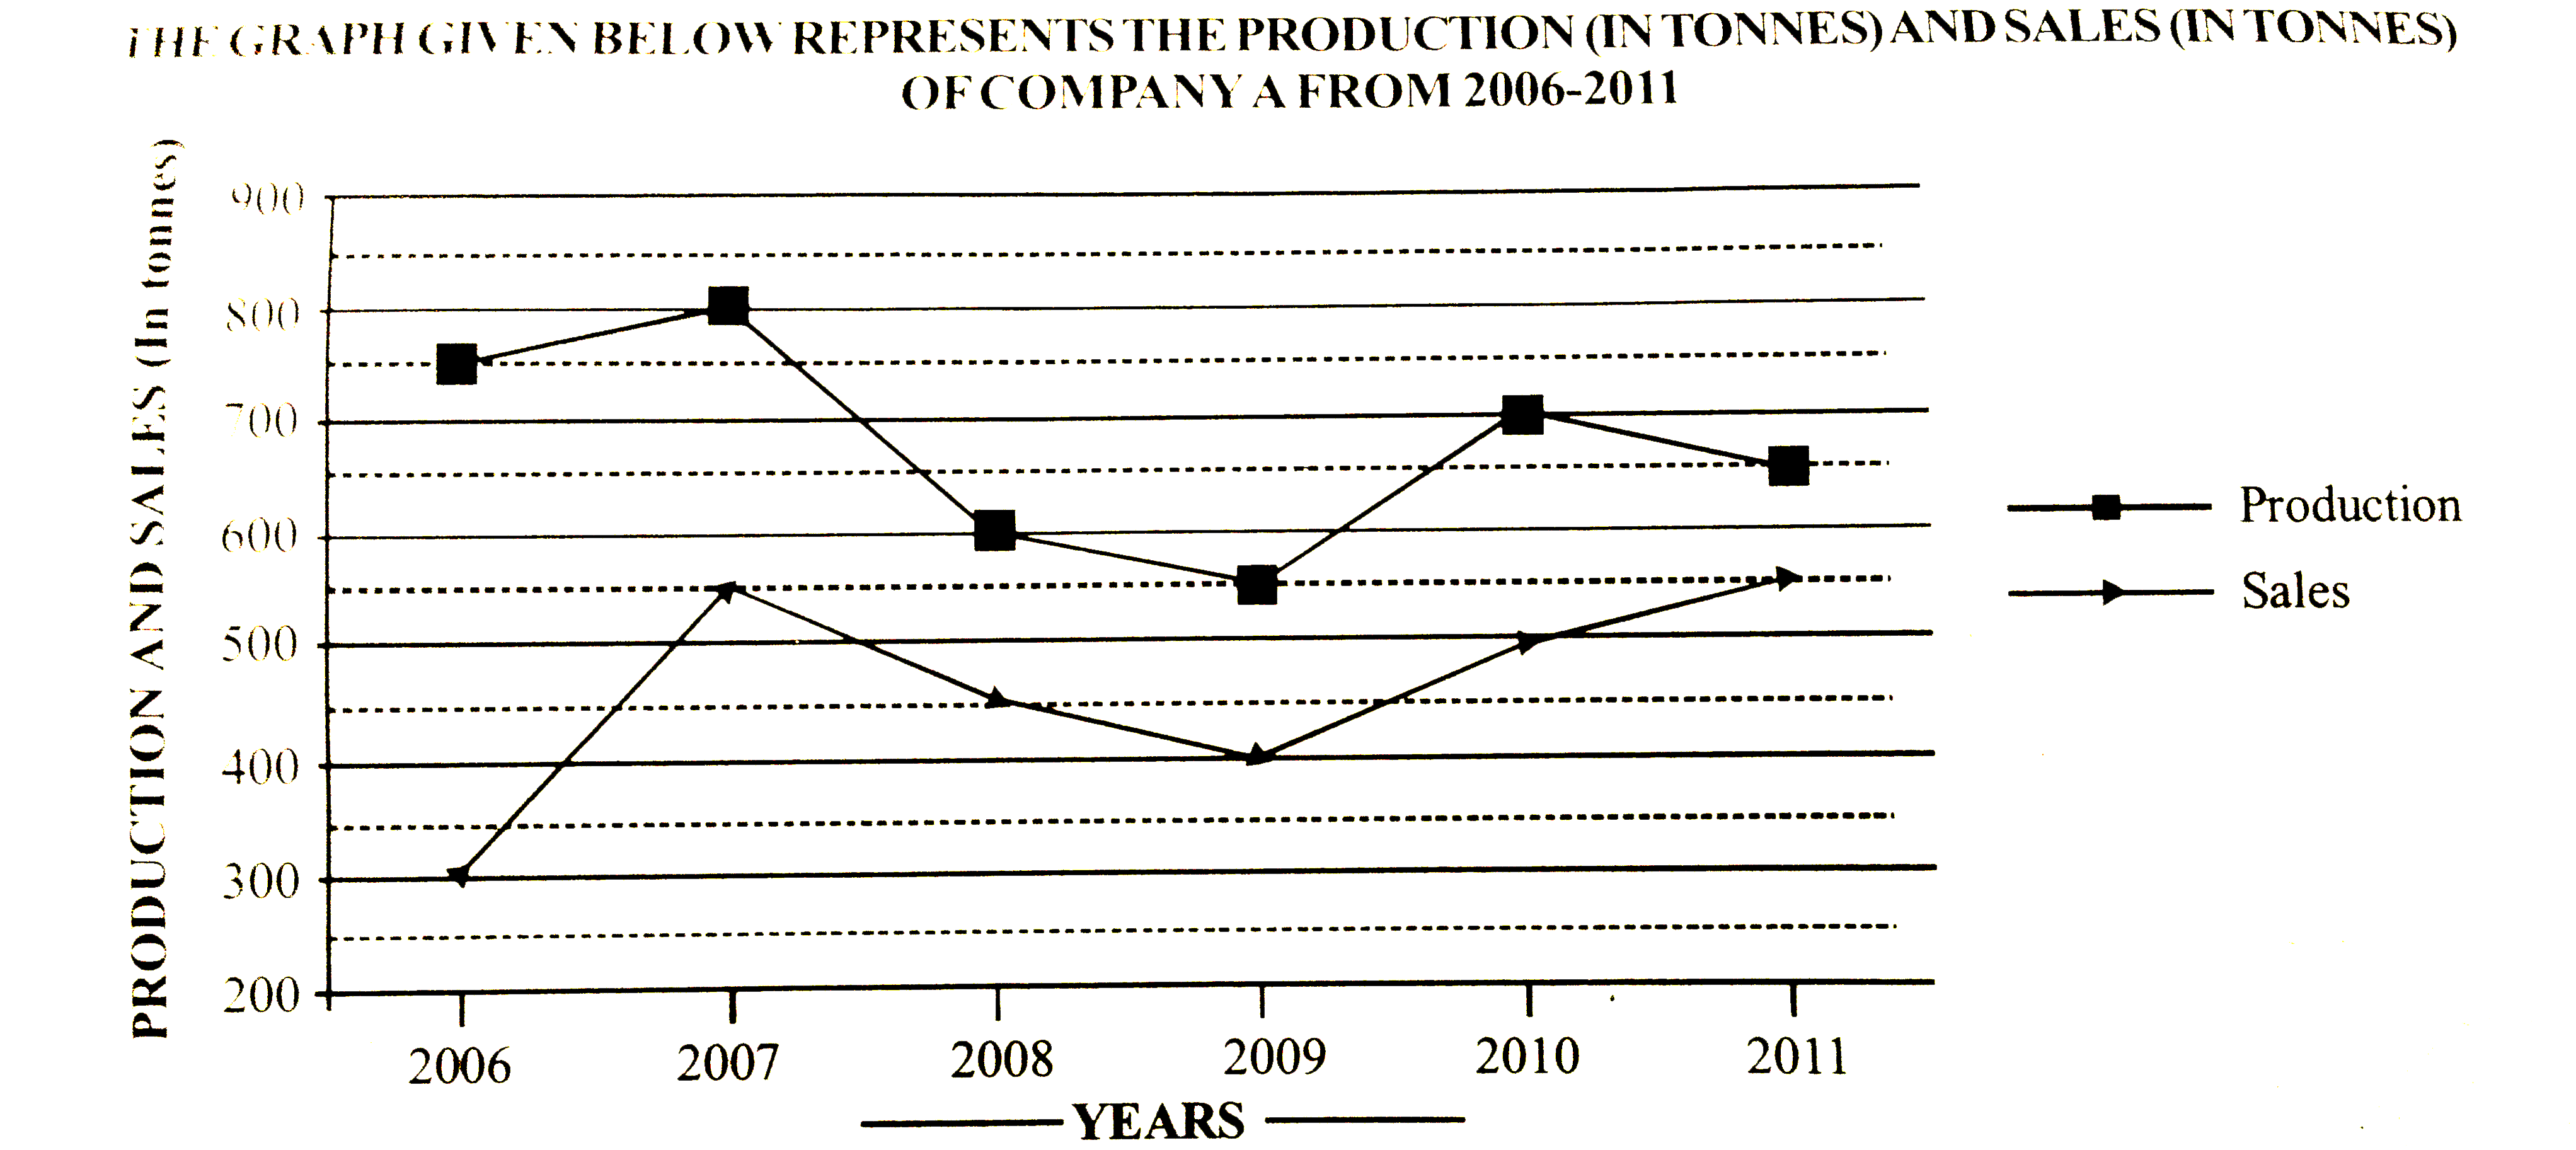
The table given below represents the respective ratio of the production (in tonners) of Company A to the production (in tonnes) of Company B, and the respective ratio of the sales (in tonnes )of Company A to the sales (in tonnes) of Company. B.
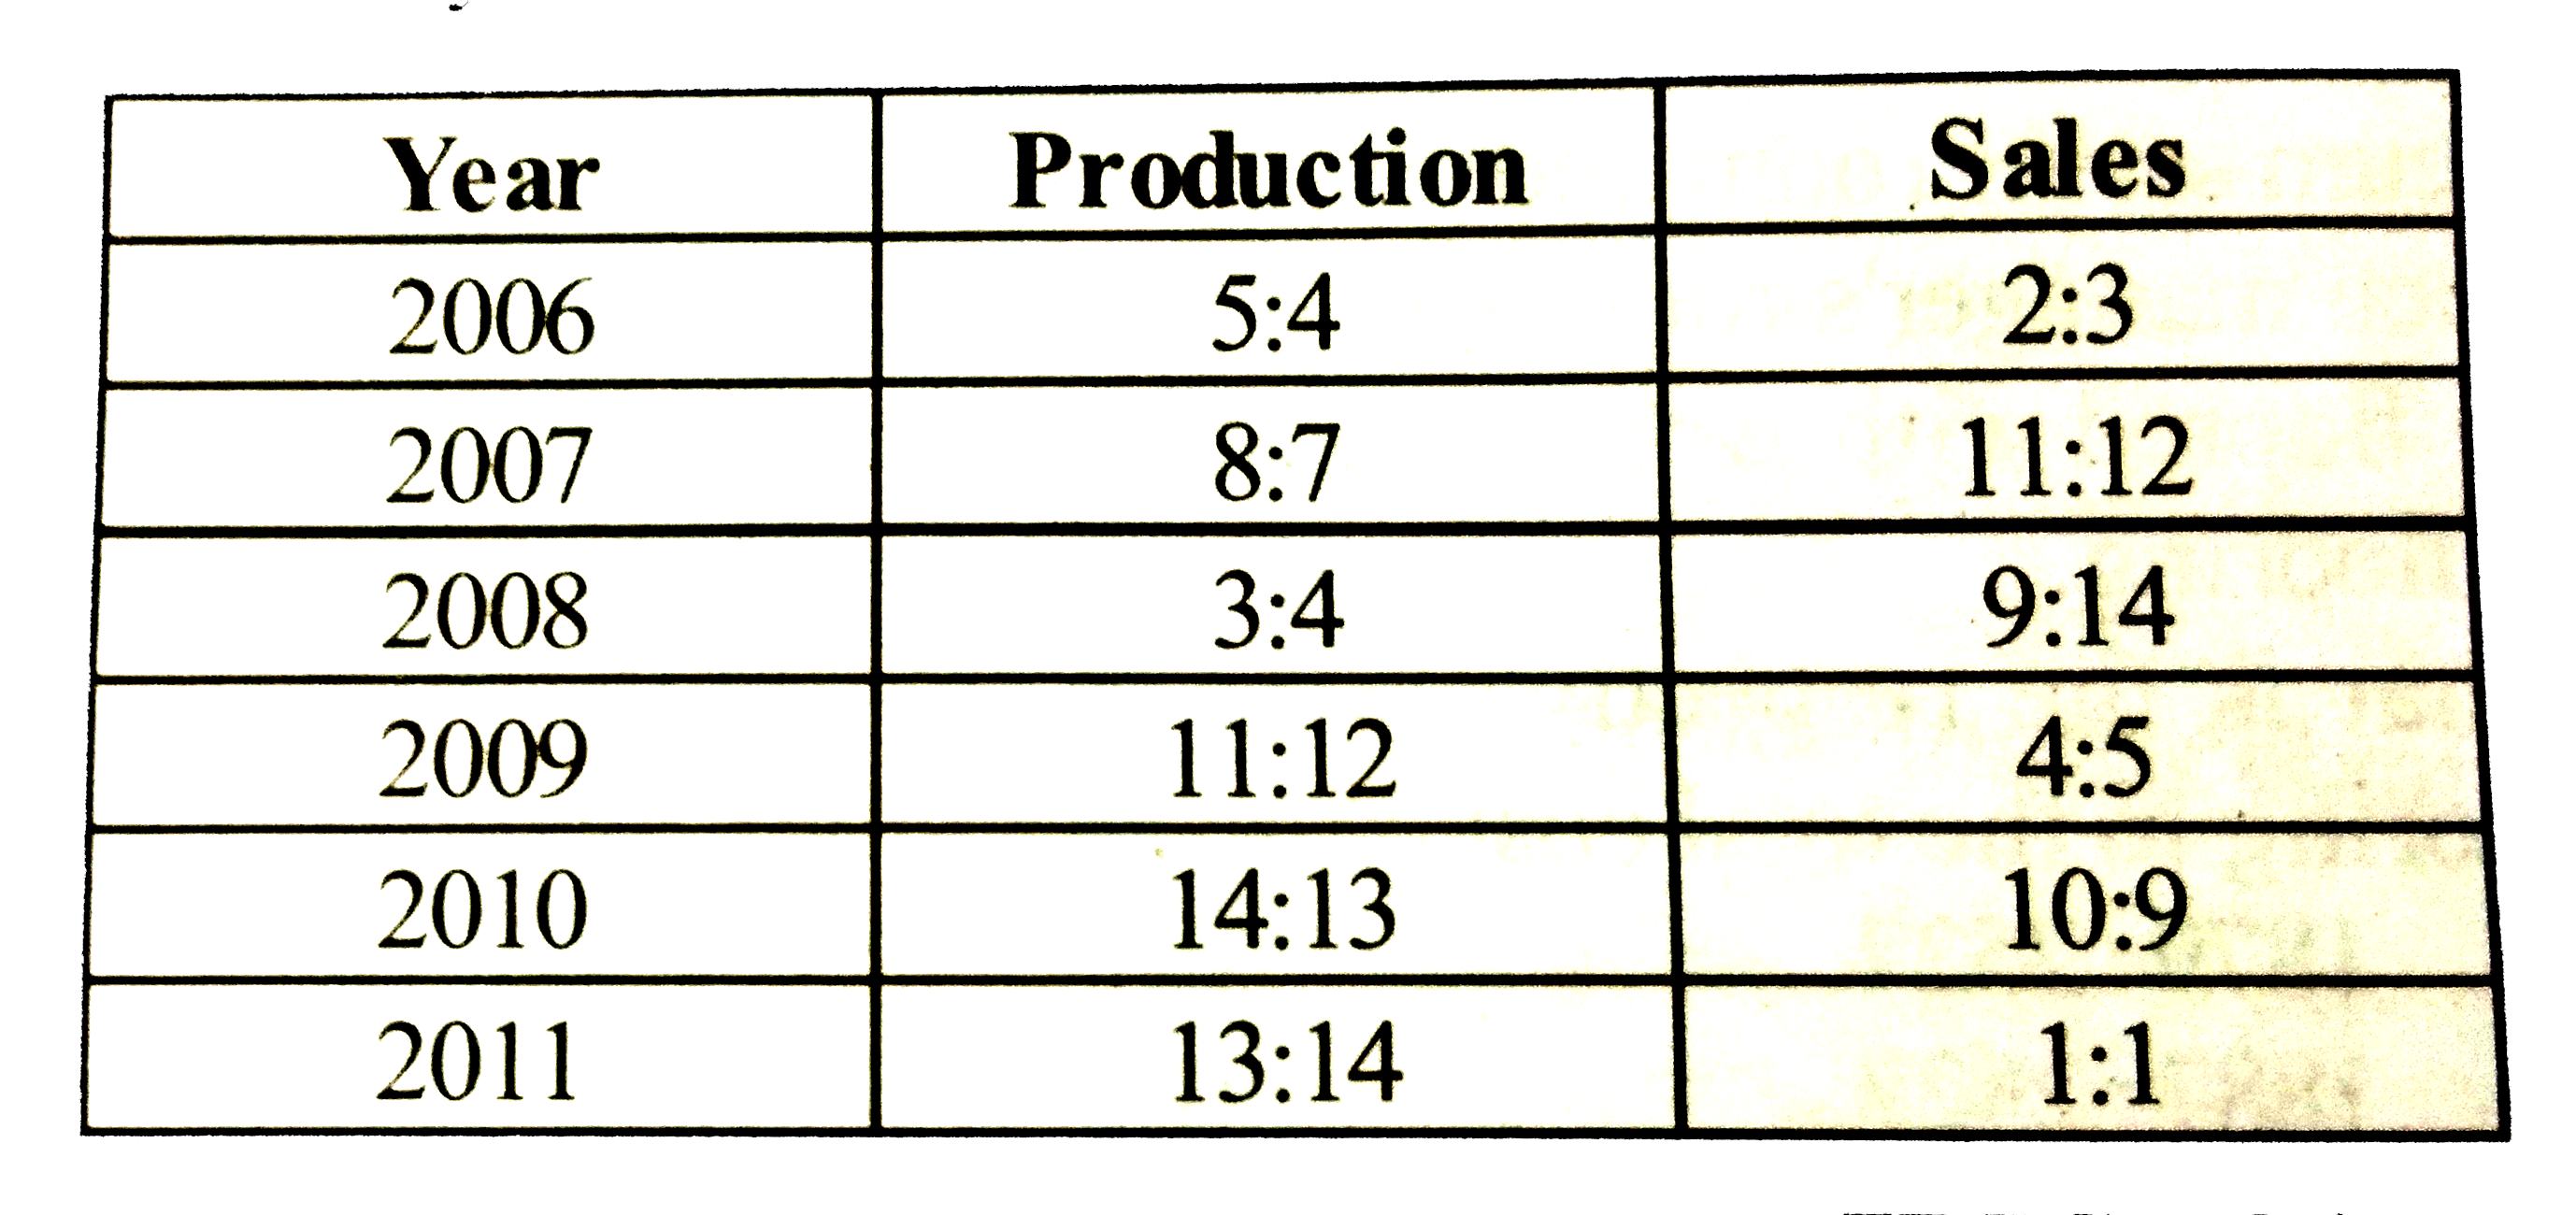
What is the average production of Company B (in tonnes from the year 2006 to the year 2011?View Solution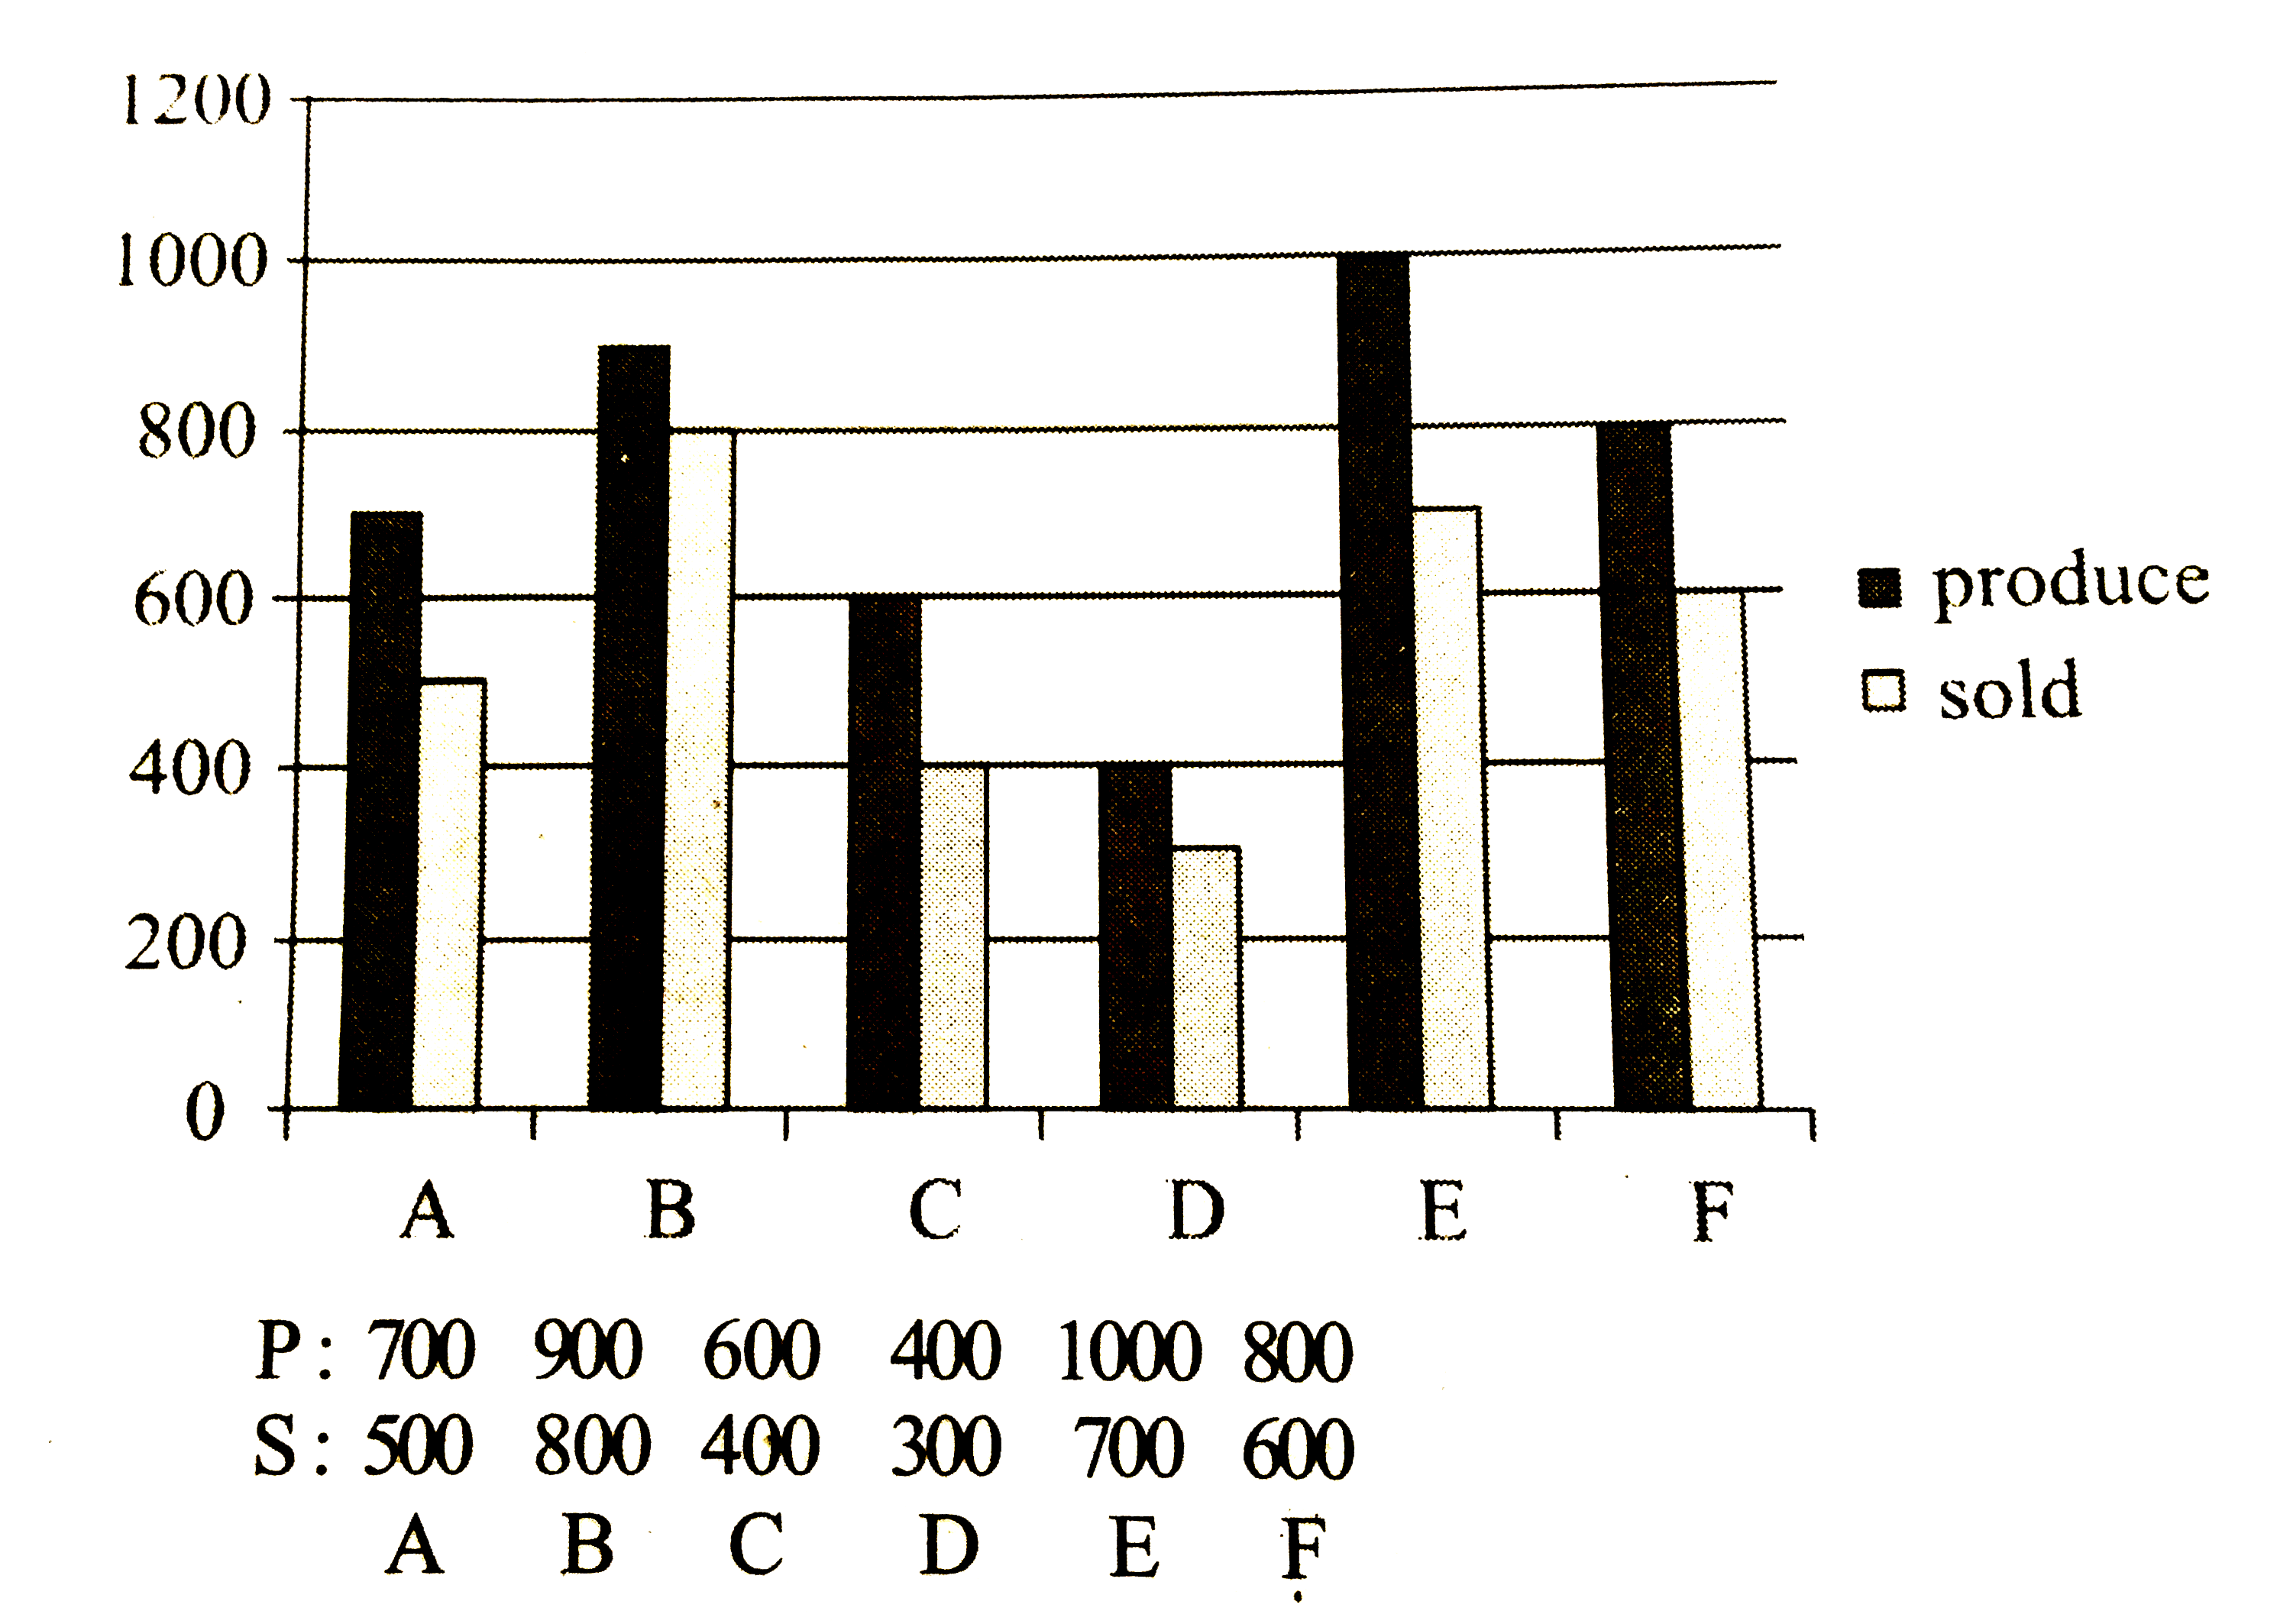
What is the ratio of the total production of the company B and C together to the total sales of the same companies ?View SolutionThere are two car manufacturing companies (Company X and Company Y). The sale of cars by these two different companies is given in different years.
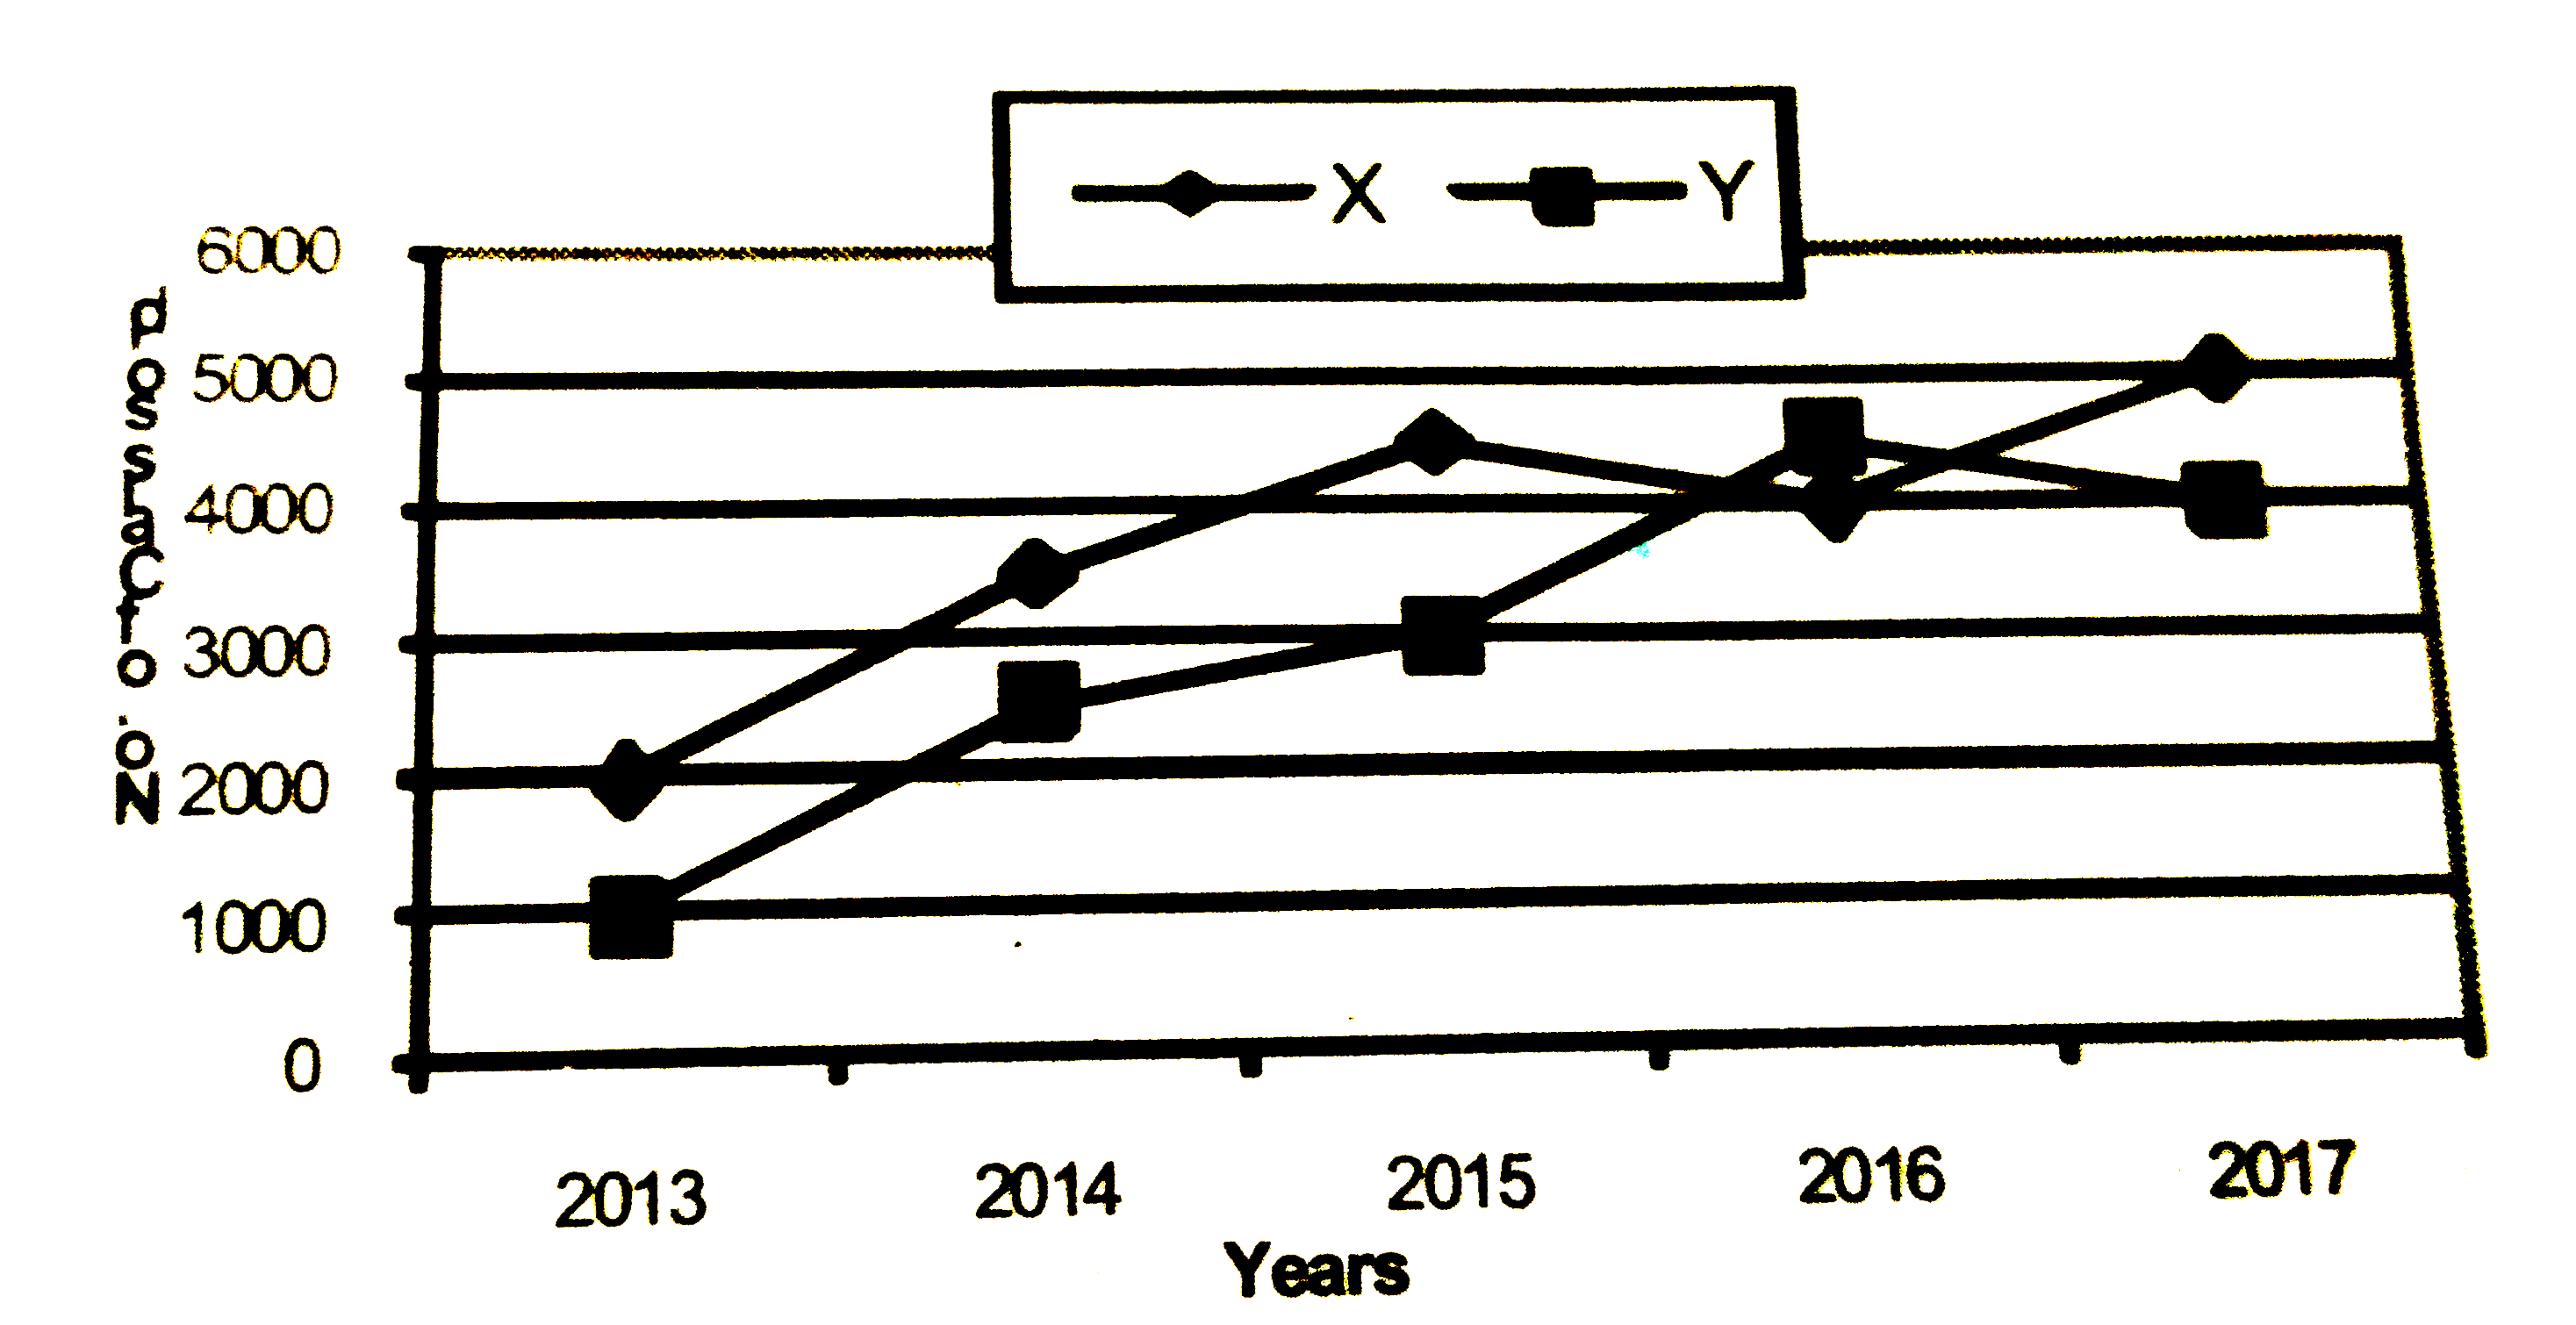
Find the ratio of the sales of company X in years 2013, 2015 and 2017 together to the total sale of company Y in year 2014 and 2016 ? together ?View Solution

