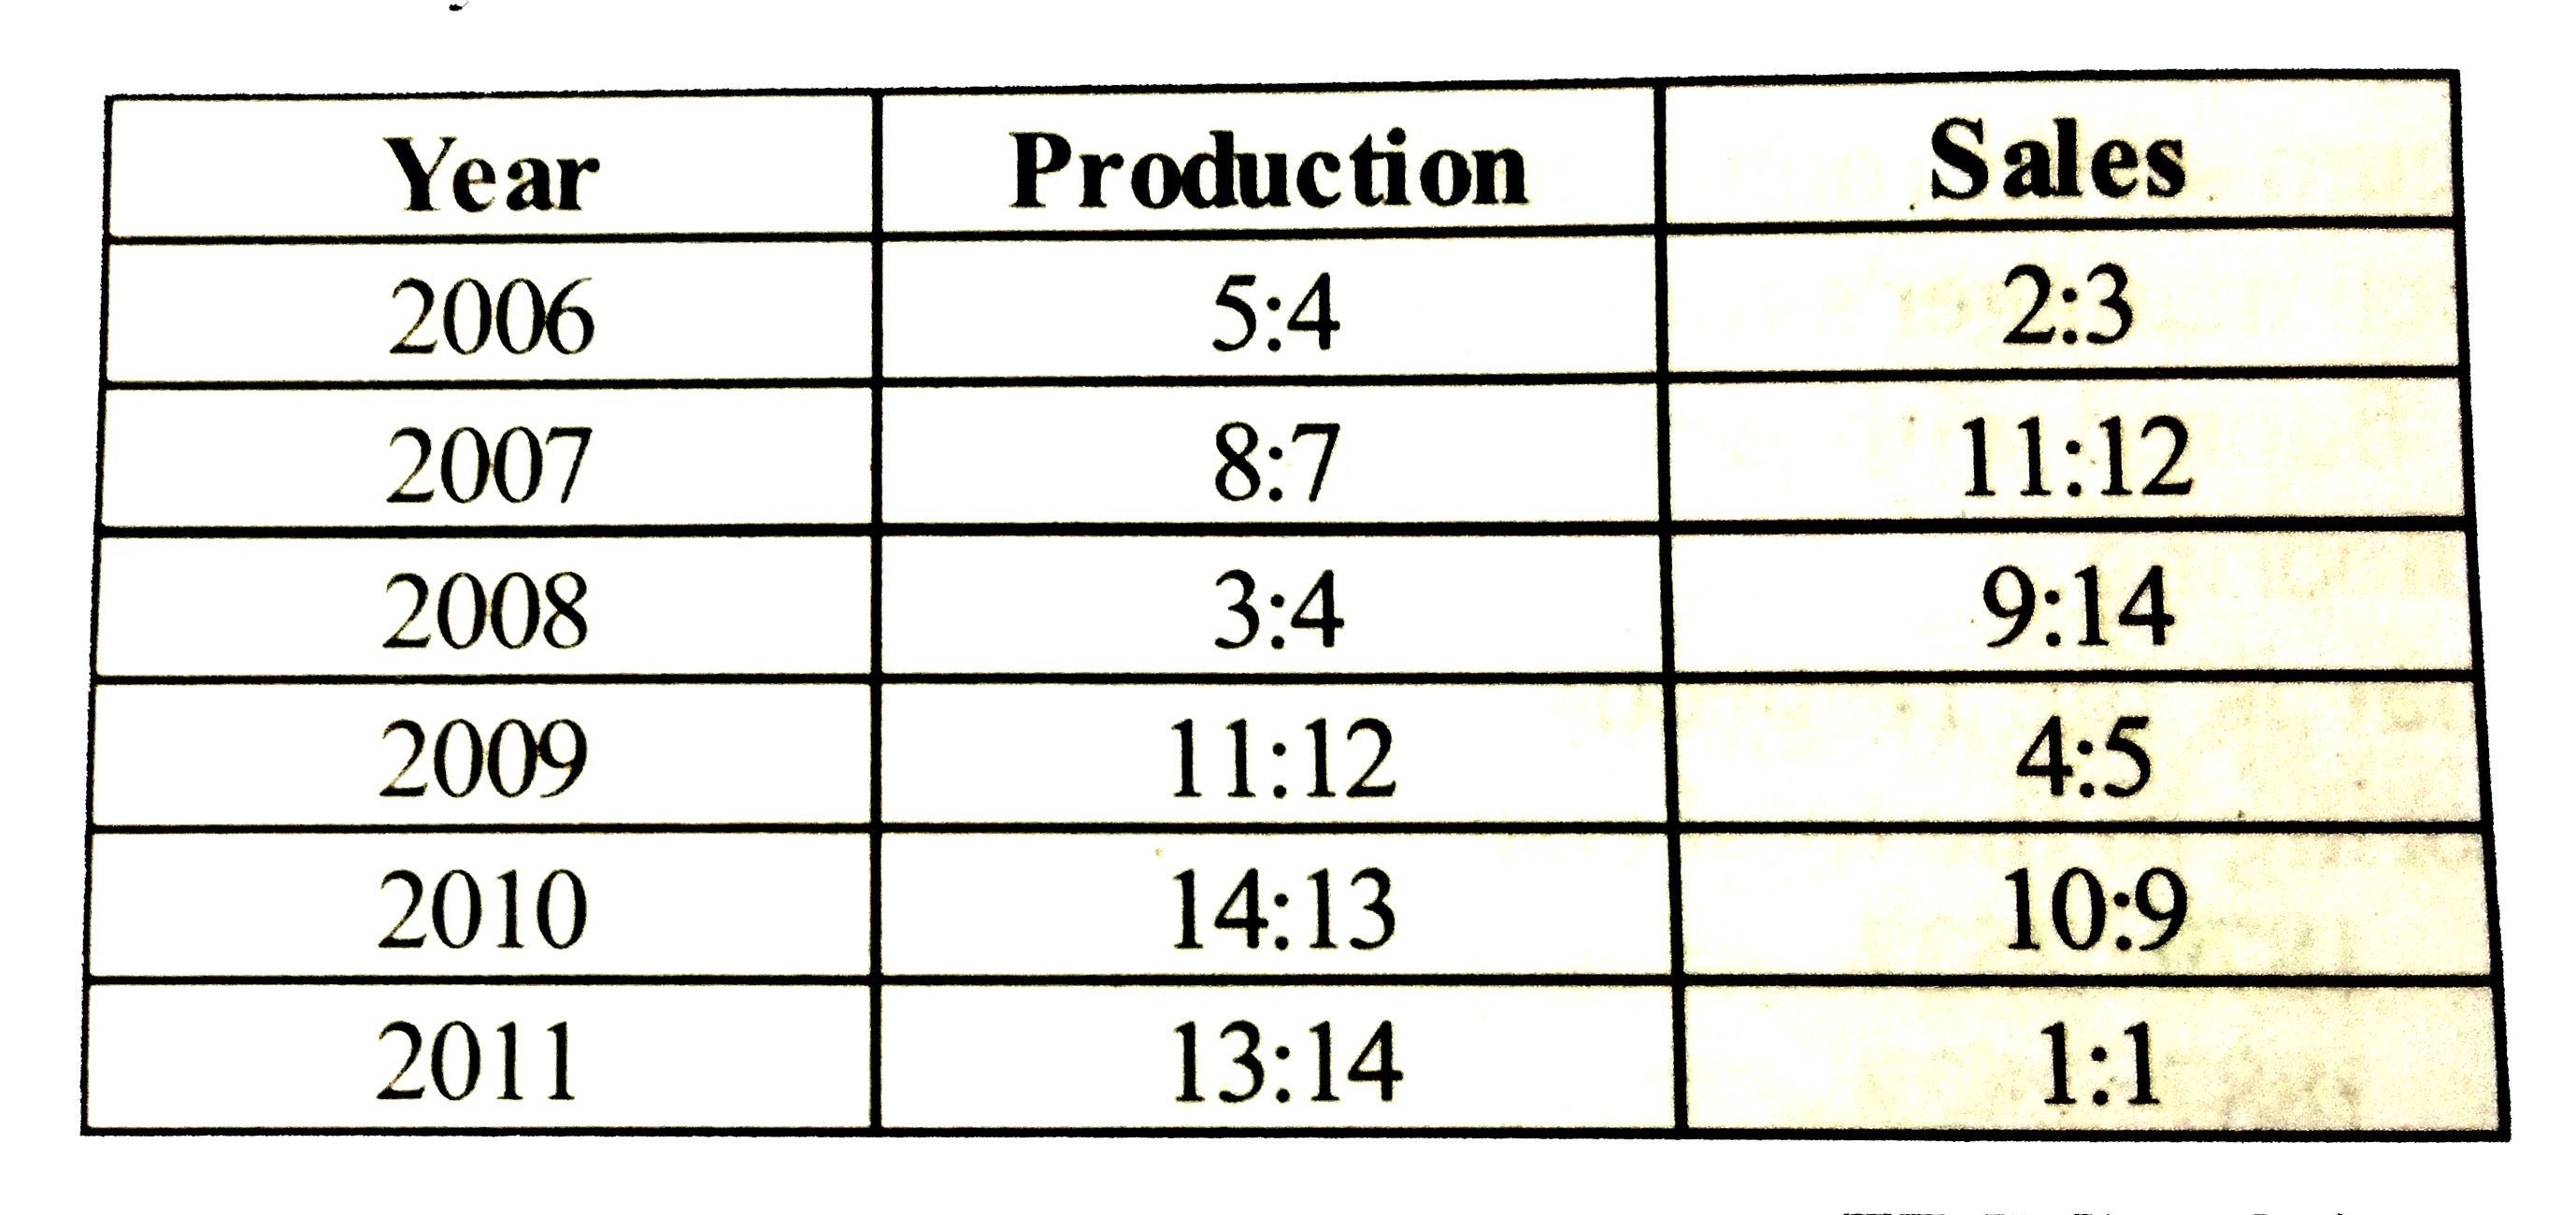
The table given below represents the respective ratio of the production (in tonners) of Company A to the production (in tonnes) of Company B, and the respective ratio of the sales (in tonnes )of Company A to the sales (in tonnes) of Company. B.
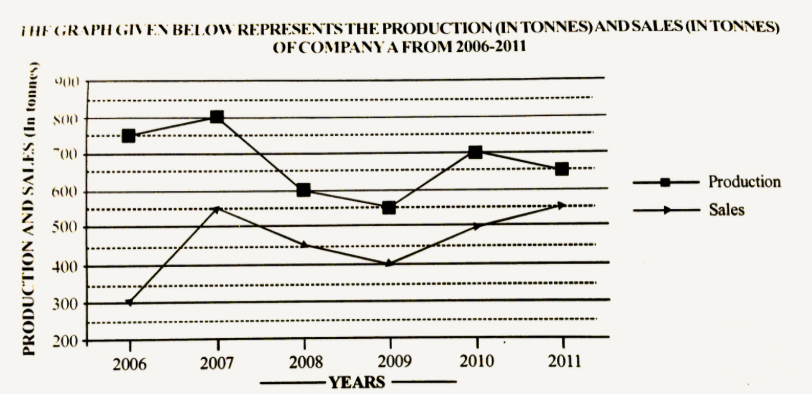
What is teh approximate perentage increases in the production of Company A(in tonnes) from the year 2009 to the production of Company A(in tonnes) in the year 2010?
18
38
23
27
The correct Answer is:D
Percentage increase=
Production of company A in 2009, ,Production of company A in 2010Productoin of company A in 2009×100
=700−550550×100=27.2≈27%
Topper's Solved these Questions
Similar Questions
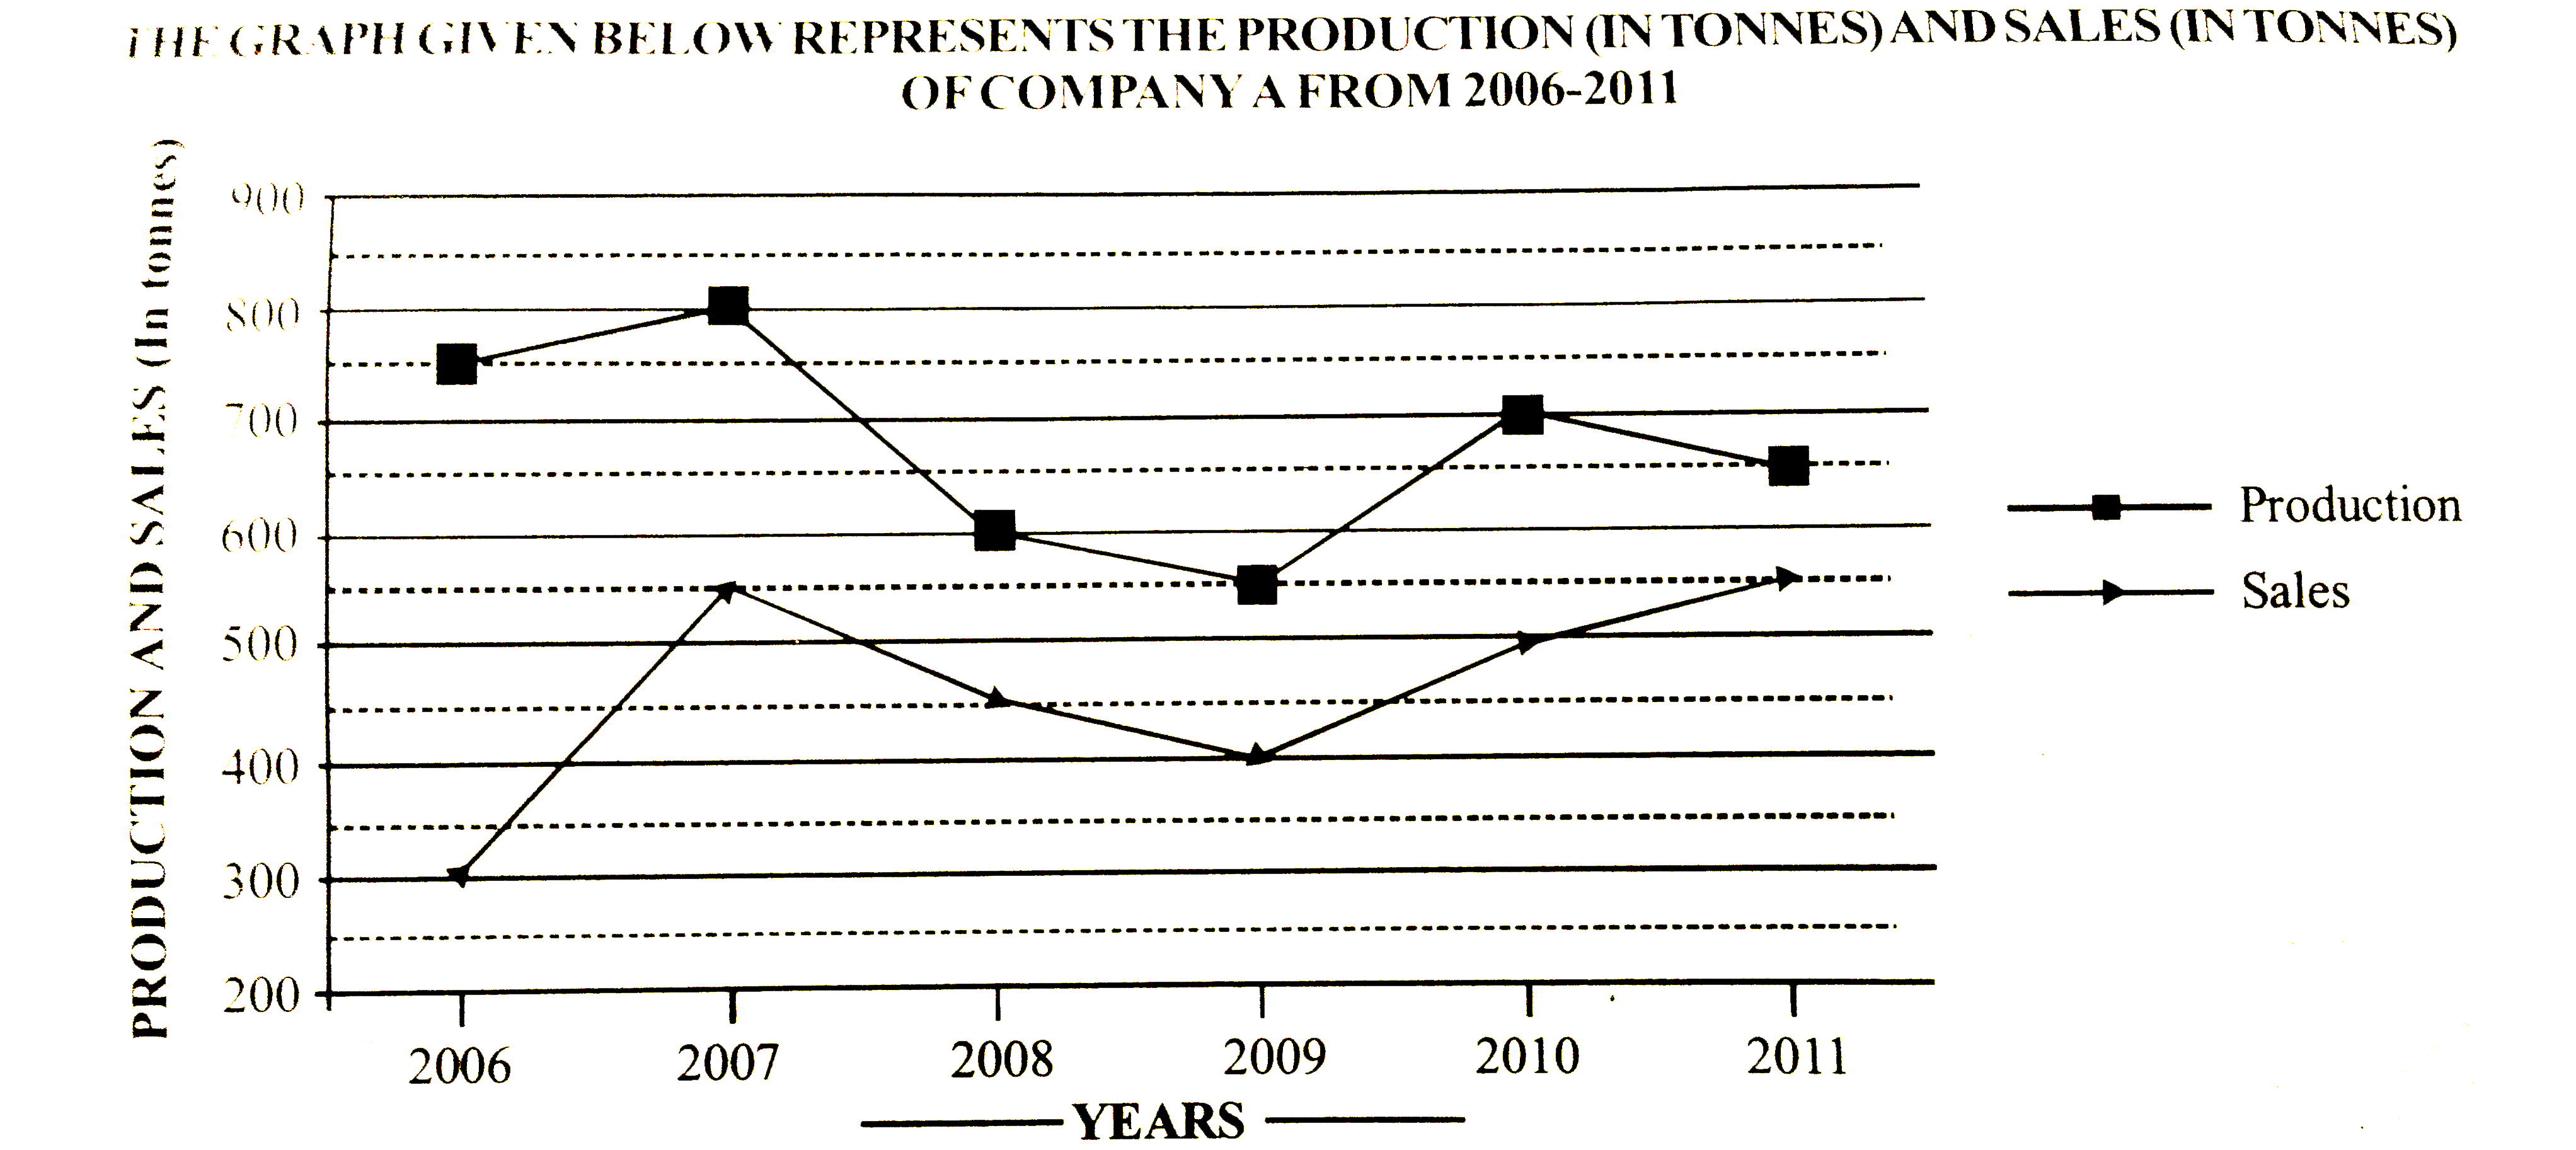
The table given below represents the respective ratio of the production (in tonners) of Company A to the production (in tonnes) of Company B, and the respective ratio of the sales (in tonnes )of Company A to the sales (in tonnes) of Company. B.
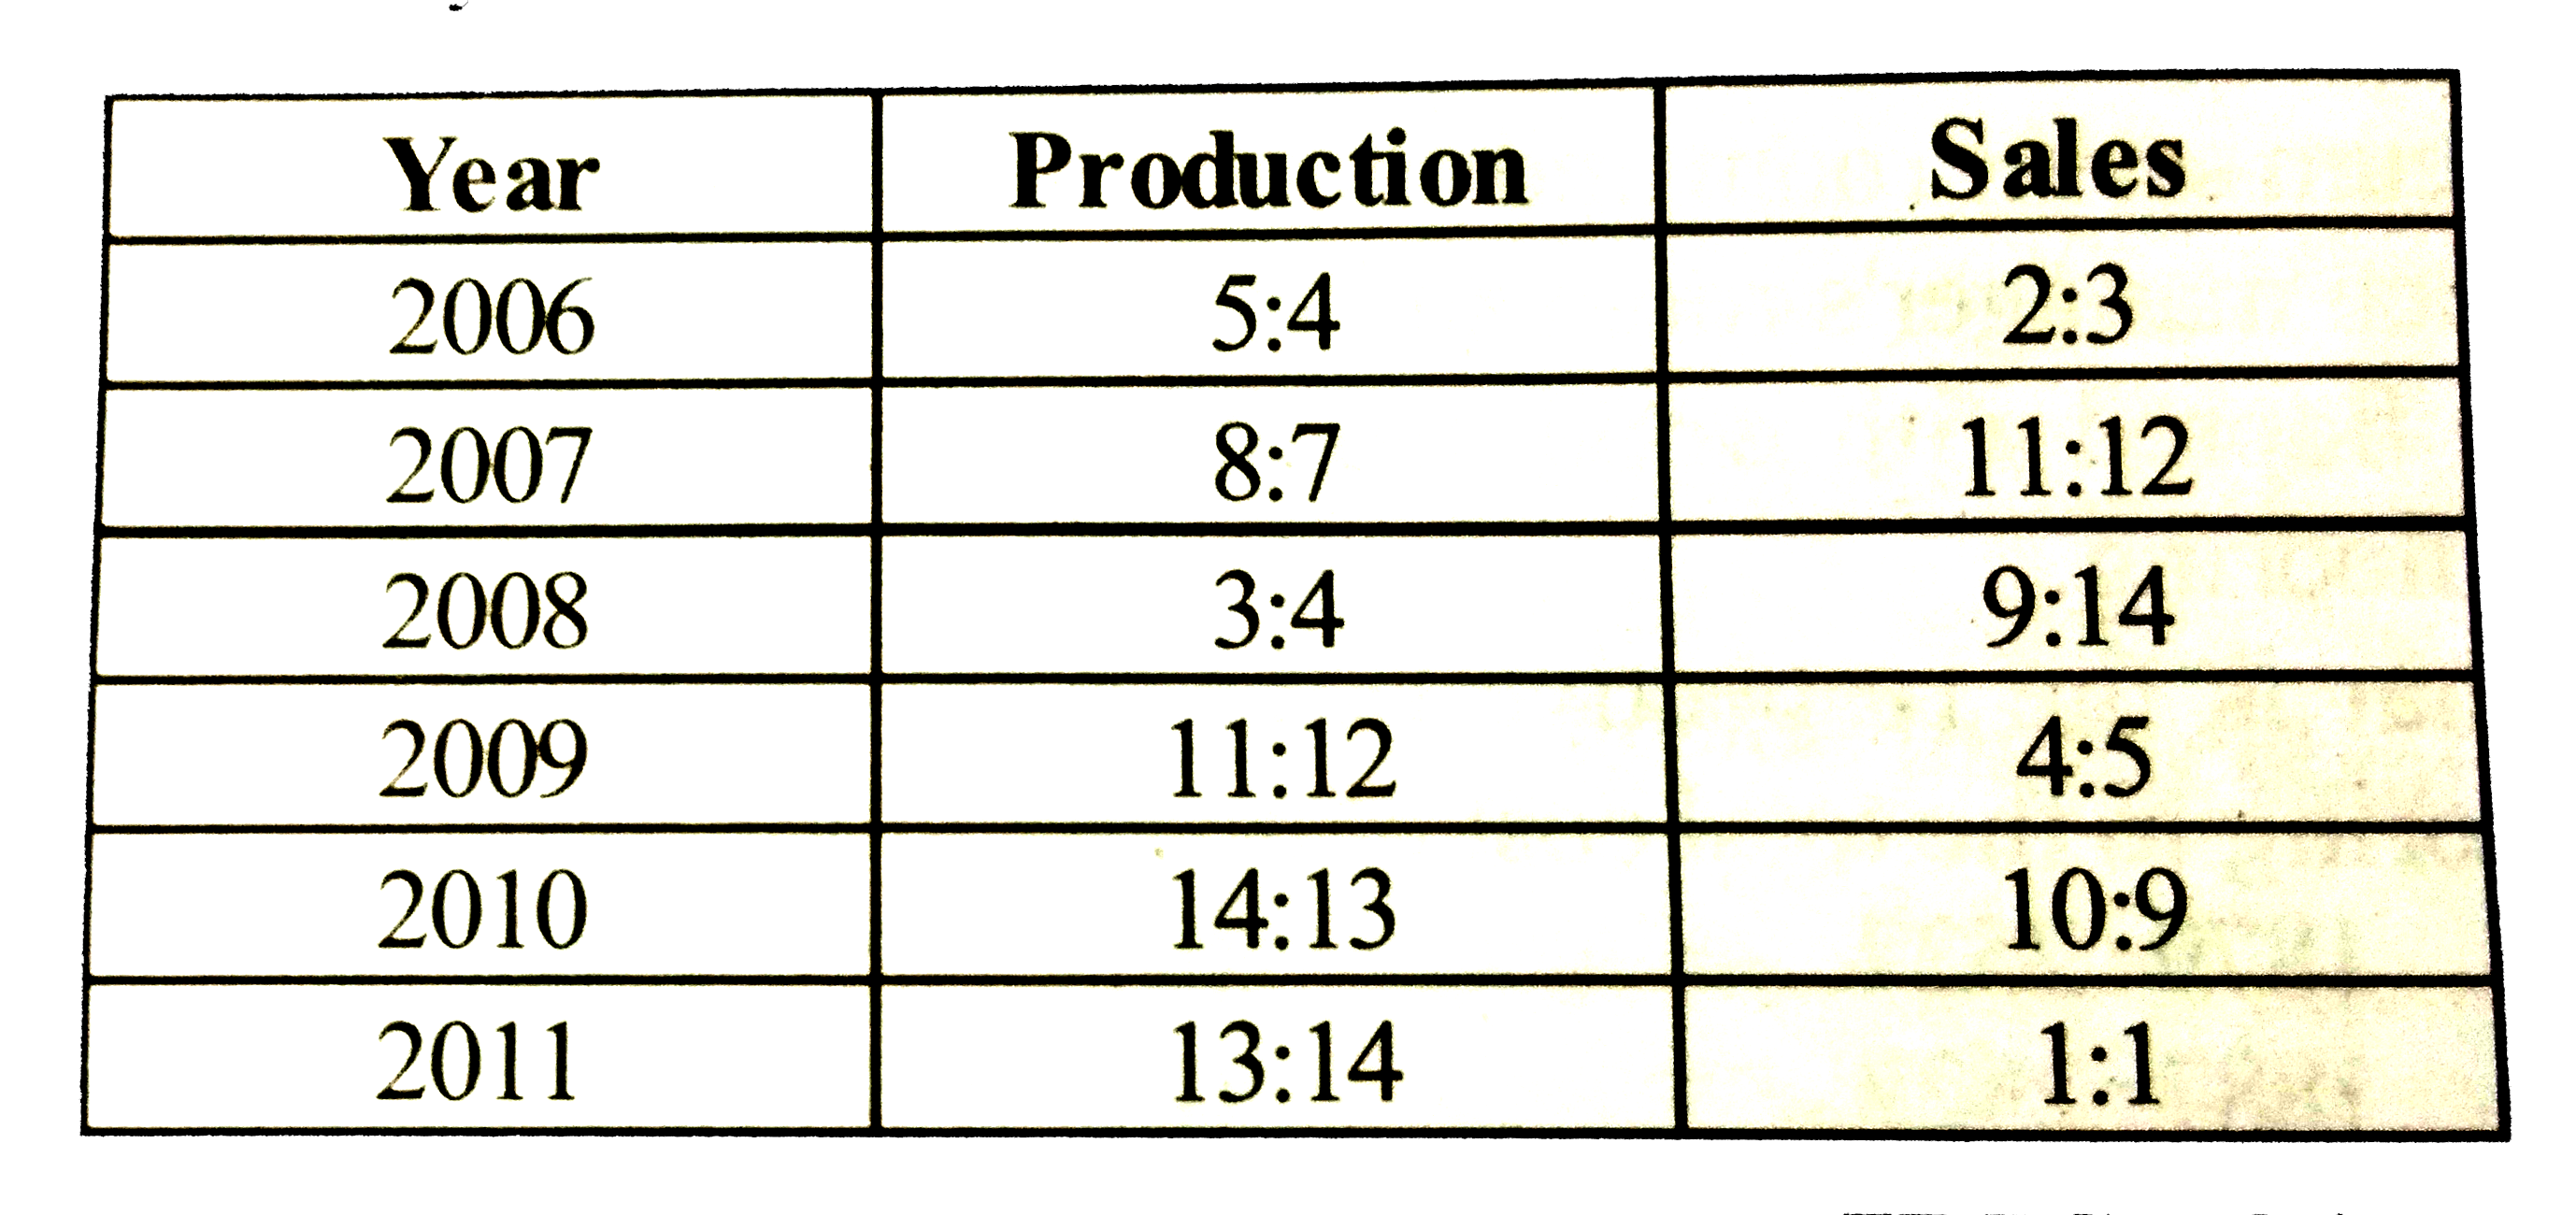
What is the respective ratio of production of Company B (in tonnes) in the year 2006 to production of Company B (in tonnes) in the year 2008?
View Solution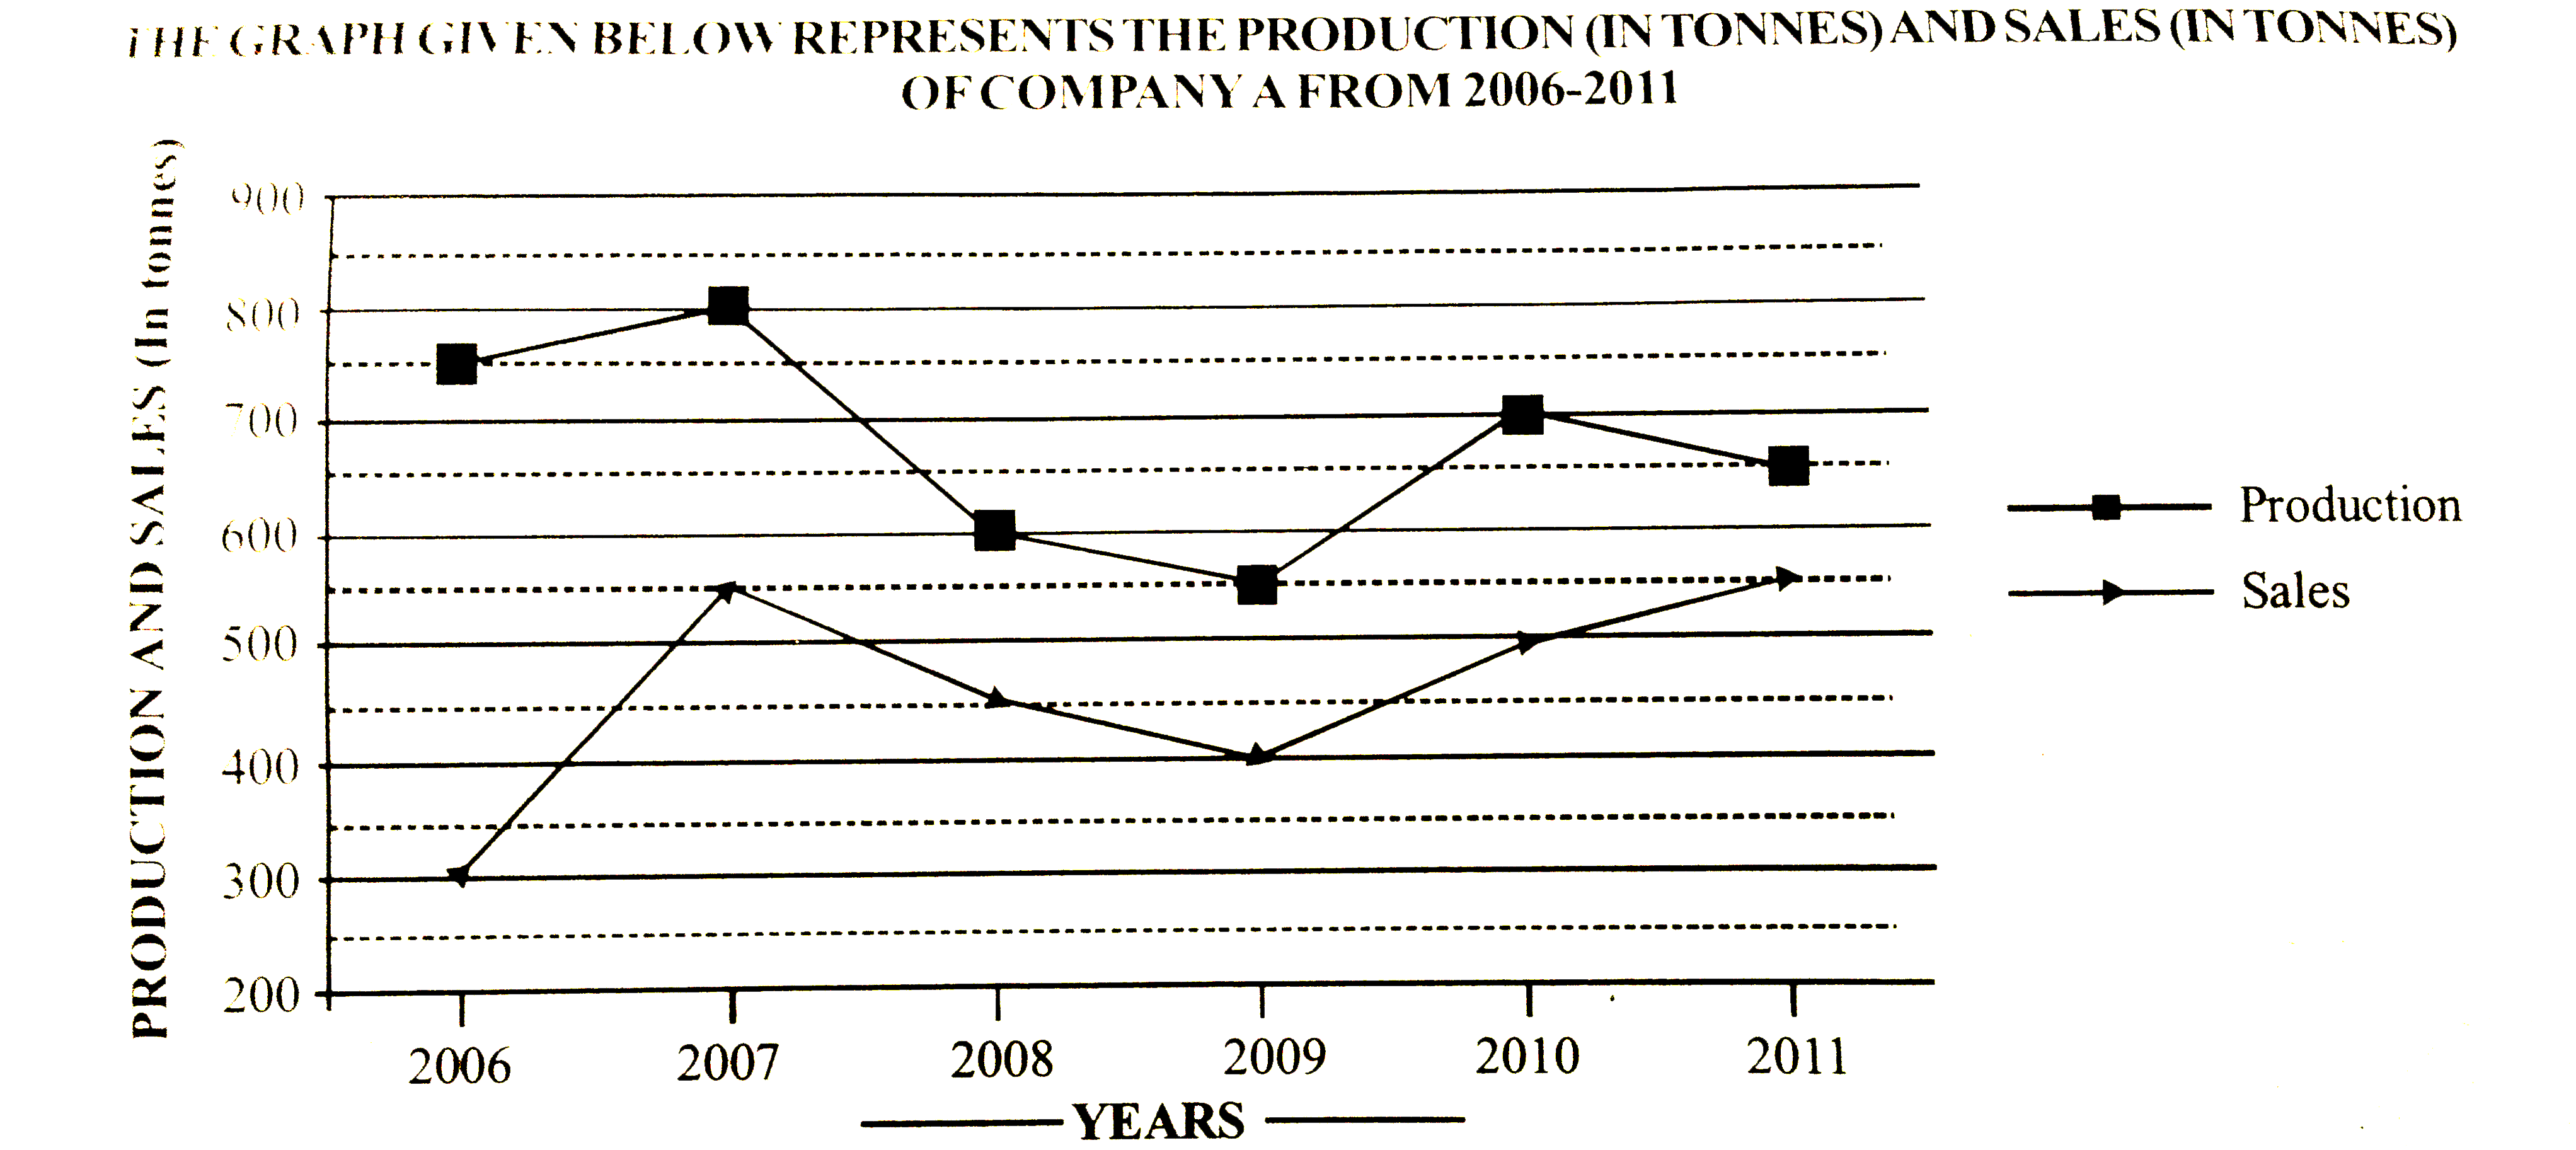
The table given below represents the respective ratio of the production (in tonners) of Company A to the production (in tonnes) of Company B, and the respective ratio of the sales (in tonnes )of Company A to the sales (in tonnes) of Company. B.
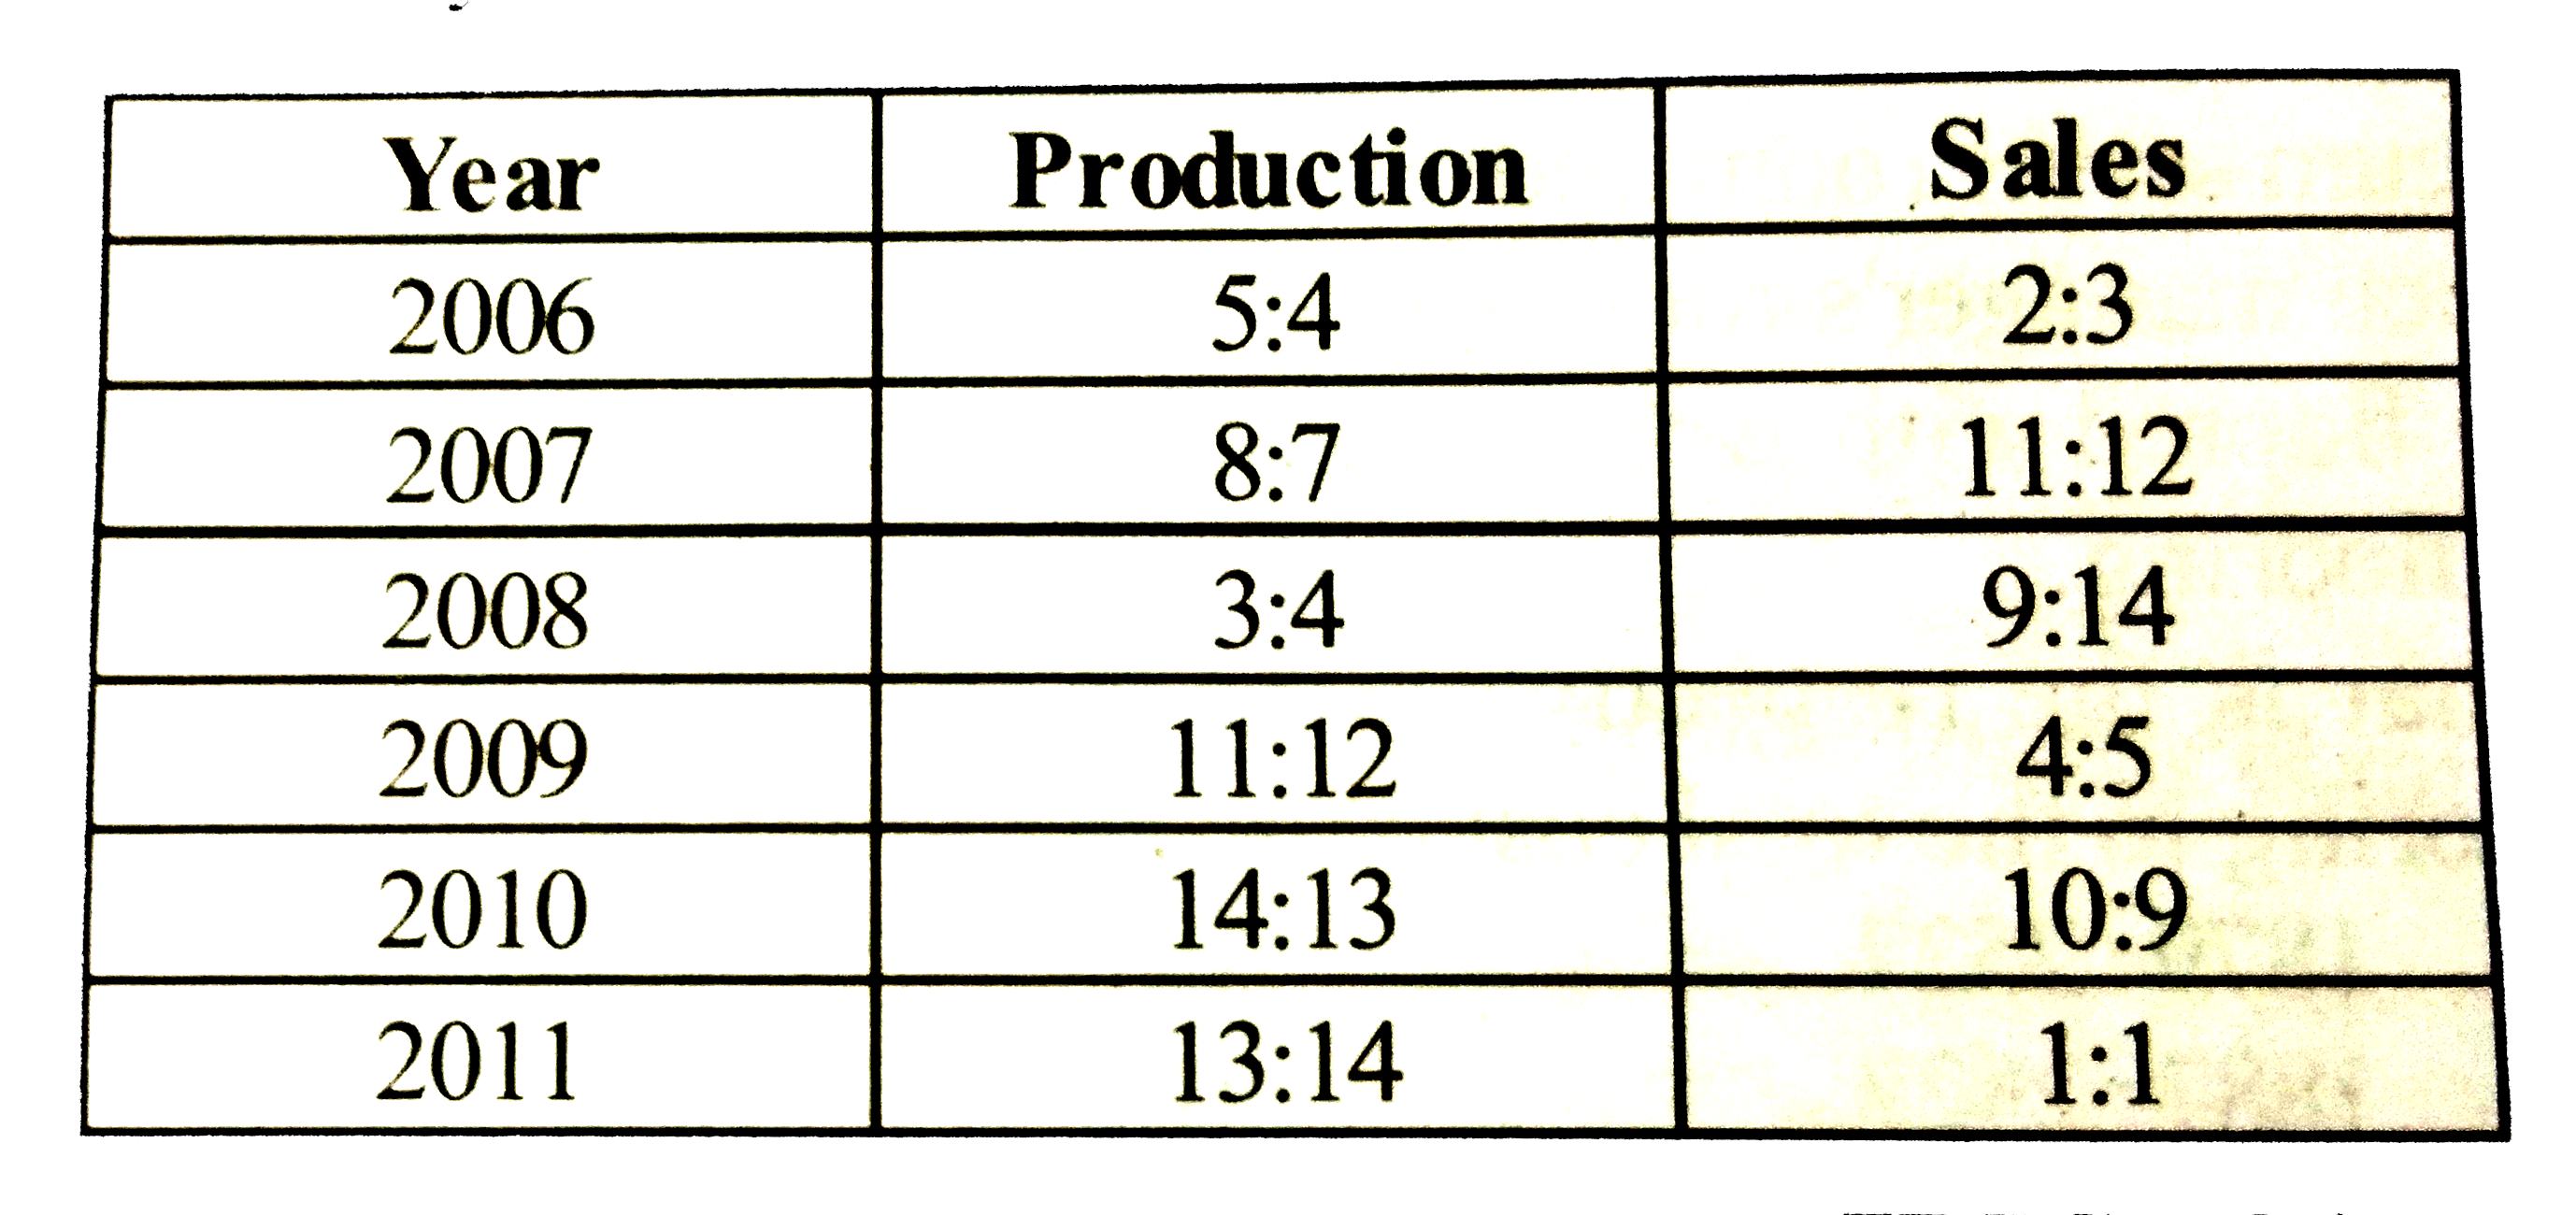
What is the average production of Company B (in tonnes from the year 2006 to the year 2011?
View Solution
Knowledge Check
Find the ratio of total sales in the two years of Company C2 and the ratio of total sales in both years of Company C4?
A9:8B7:9C7:3D5:6The table given below shows the production (in '000 tonnes) of five companies from 2012 to 2016.
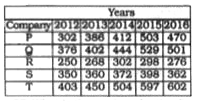
What is the total production (in '000 tonnes) of company R from year 2012 to 2016?A1276B1444C1394D1502The table given below shows the production (in '000 tonnes) of five companies from 2012 to 2016.
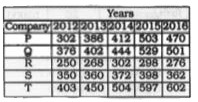
The production of company R in year 2014 is how much per cent more than the production of company R in the year 2013?A12.68B11.56C14.42D15.31
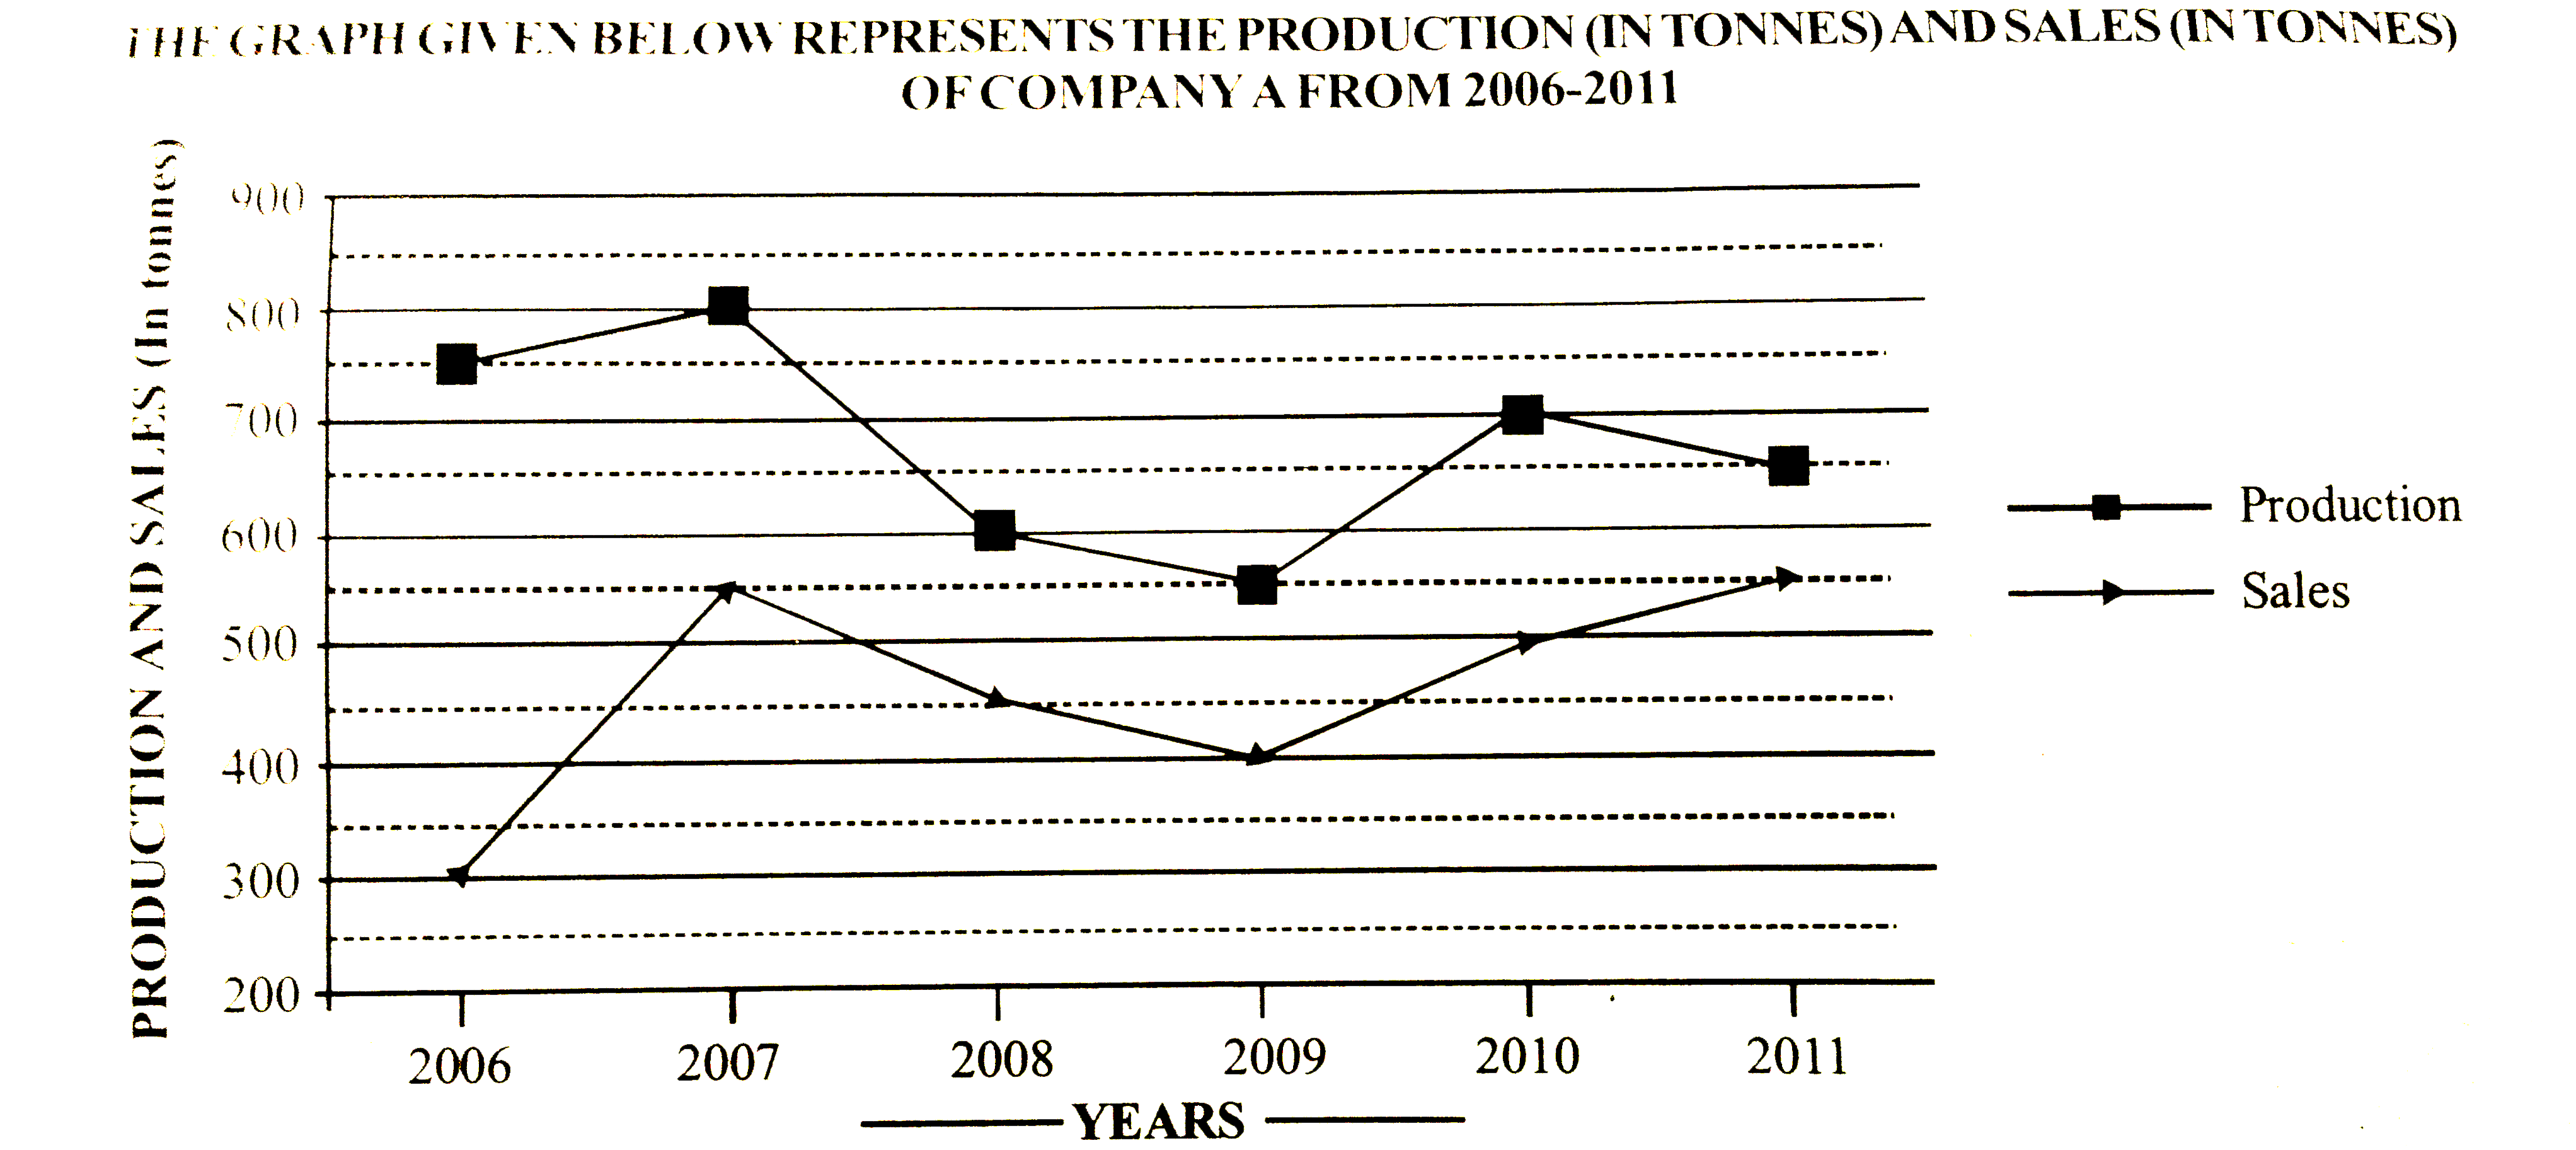
The table given below represents the respective ratio of the production (in tonnes) of Company A to the production (in tonnes) of Company B, and the respective ratio of the sales (in tonnes )of Company A to the sales (in tonnes) of Company. B.
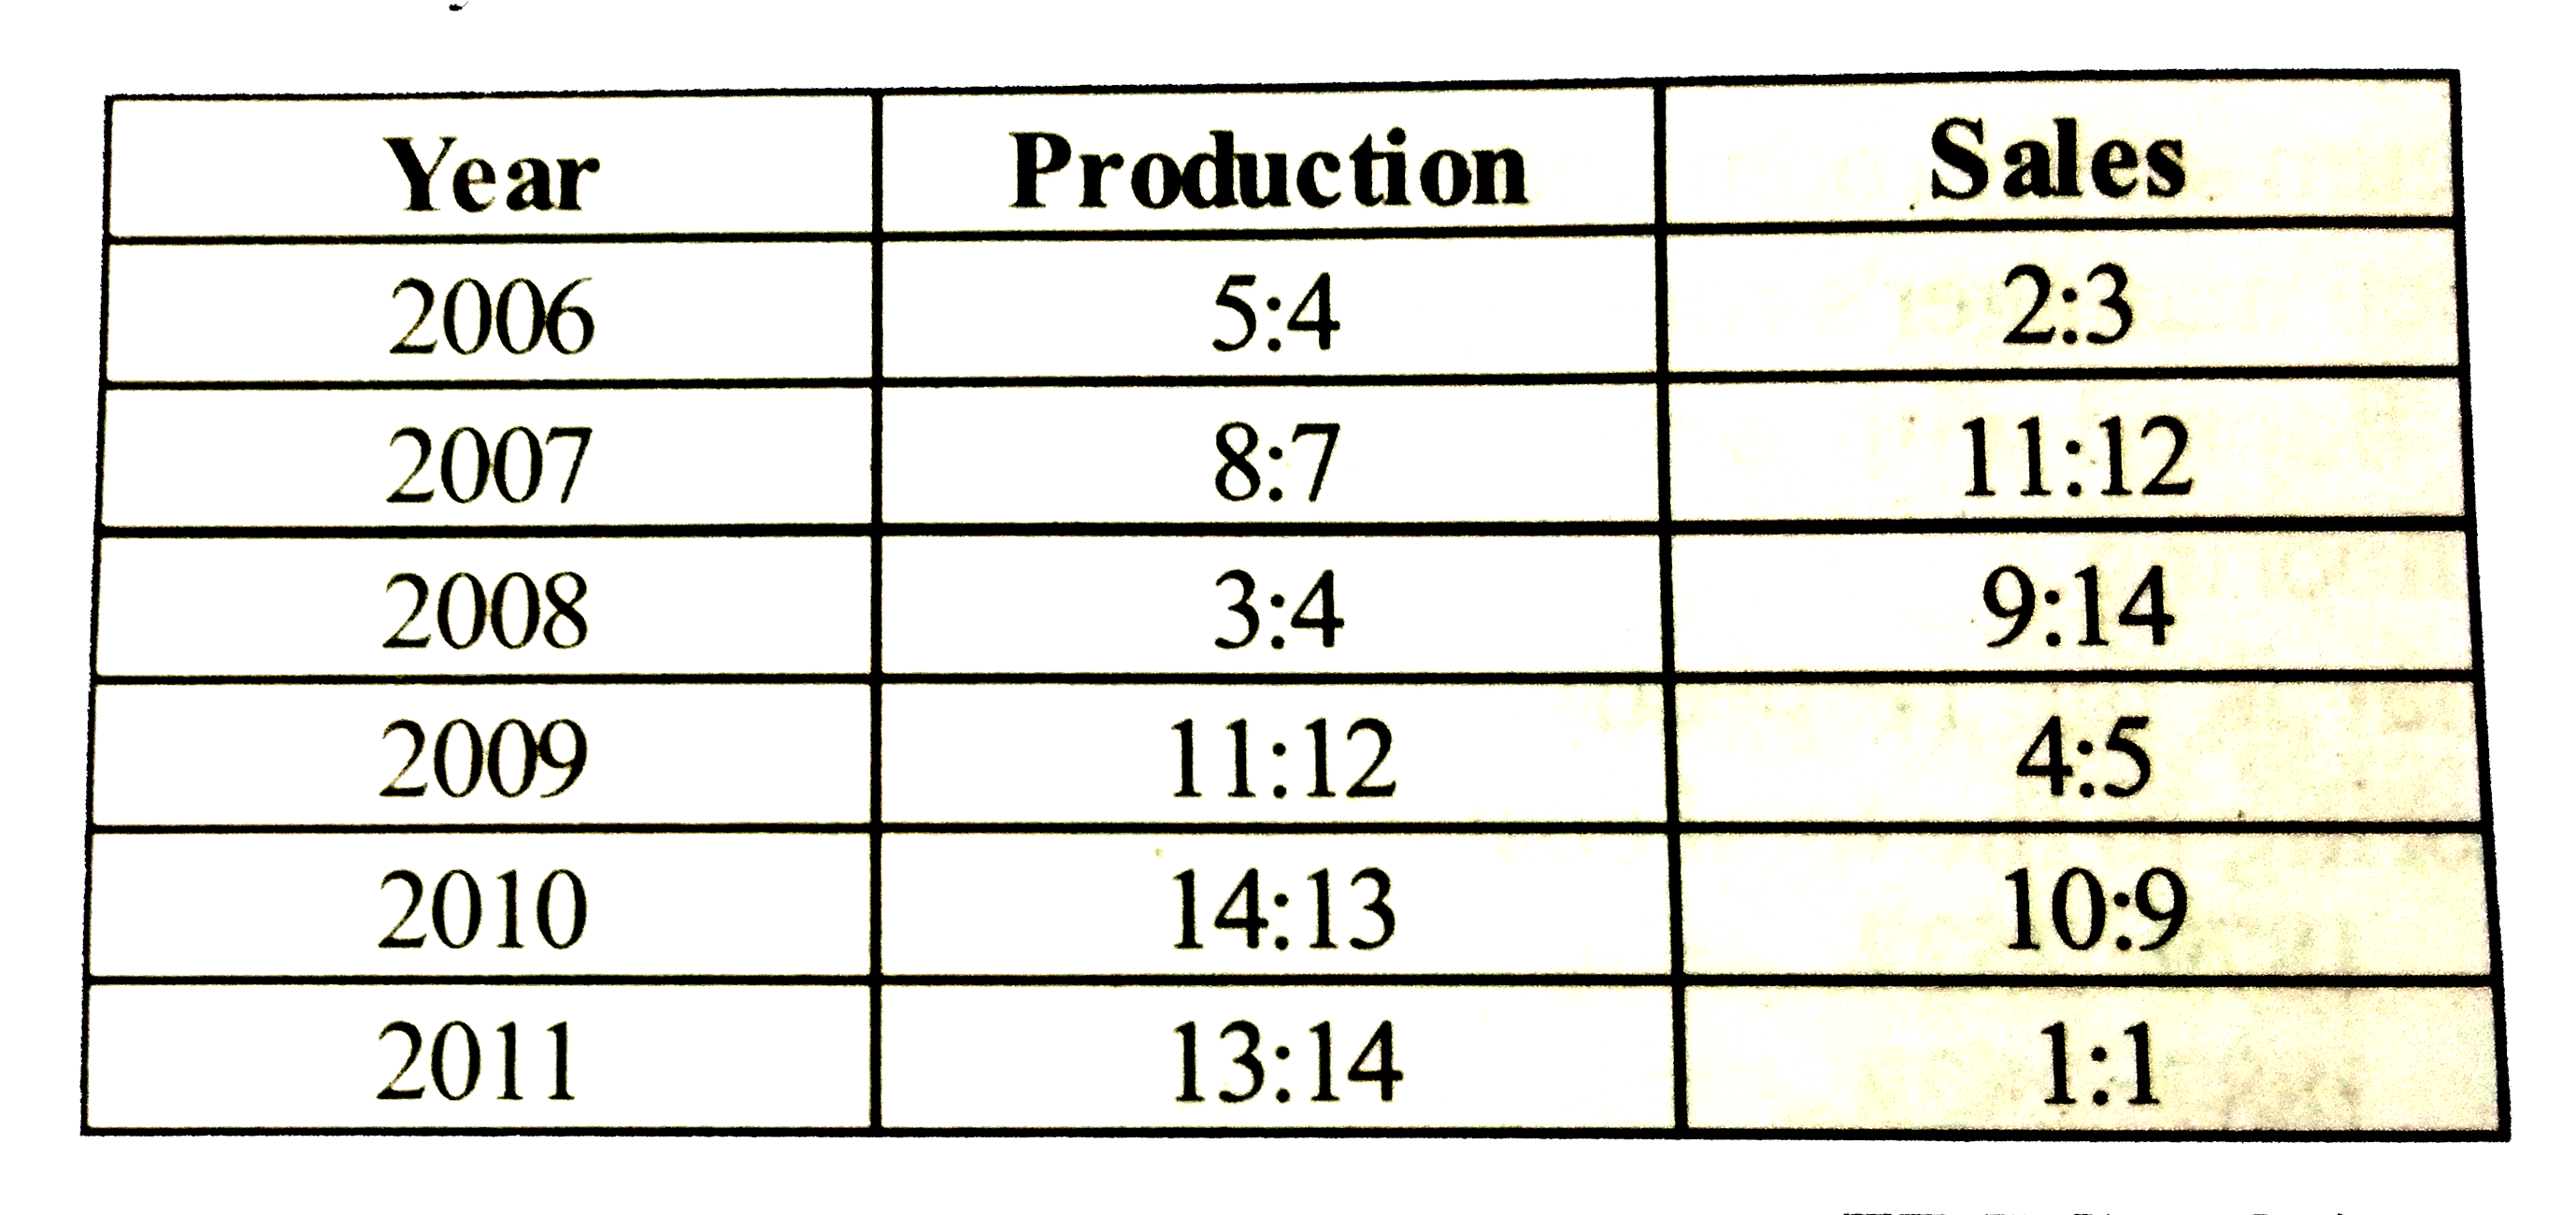
The sales of Company A in the year 2009 was approximately what percent of the production of Company A in the same year ?
View Solution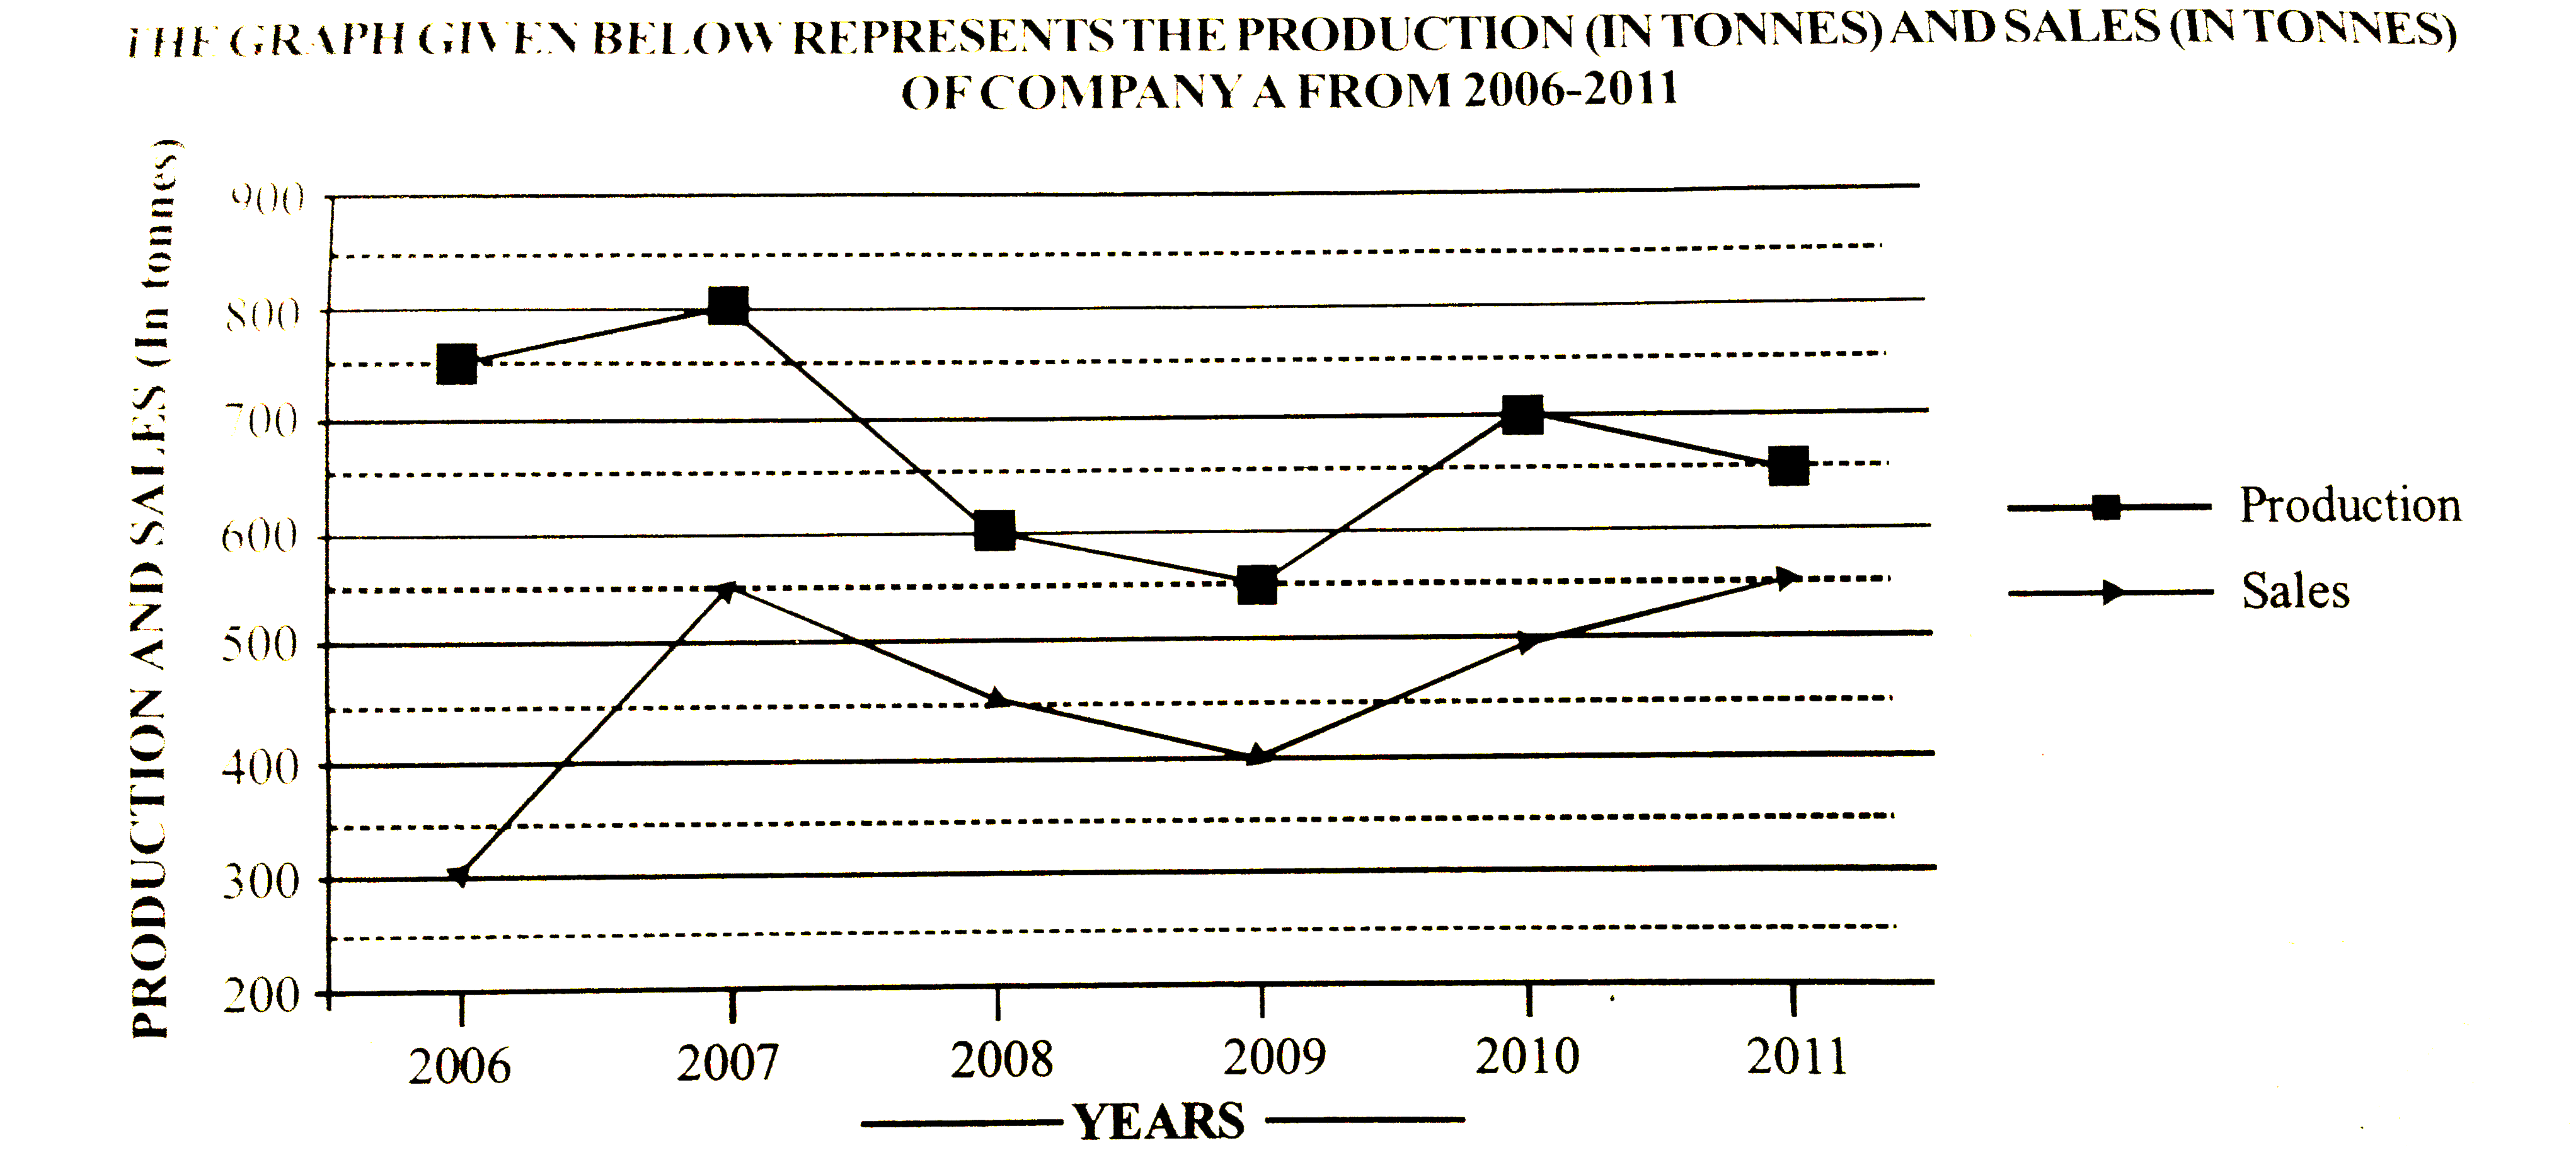
The table given below represents the respective ratio of the production (in tonners) of Company A to the production (in tonnes) of Company B, and the respective ratio of the sales (in tonnes )of Company A to the sales (in tonnes) of Company. B.
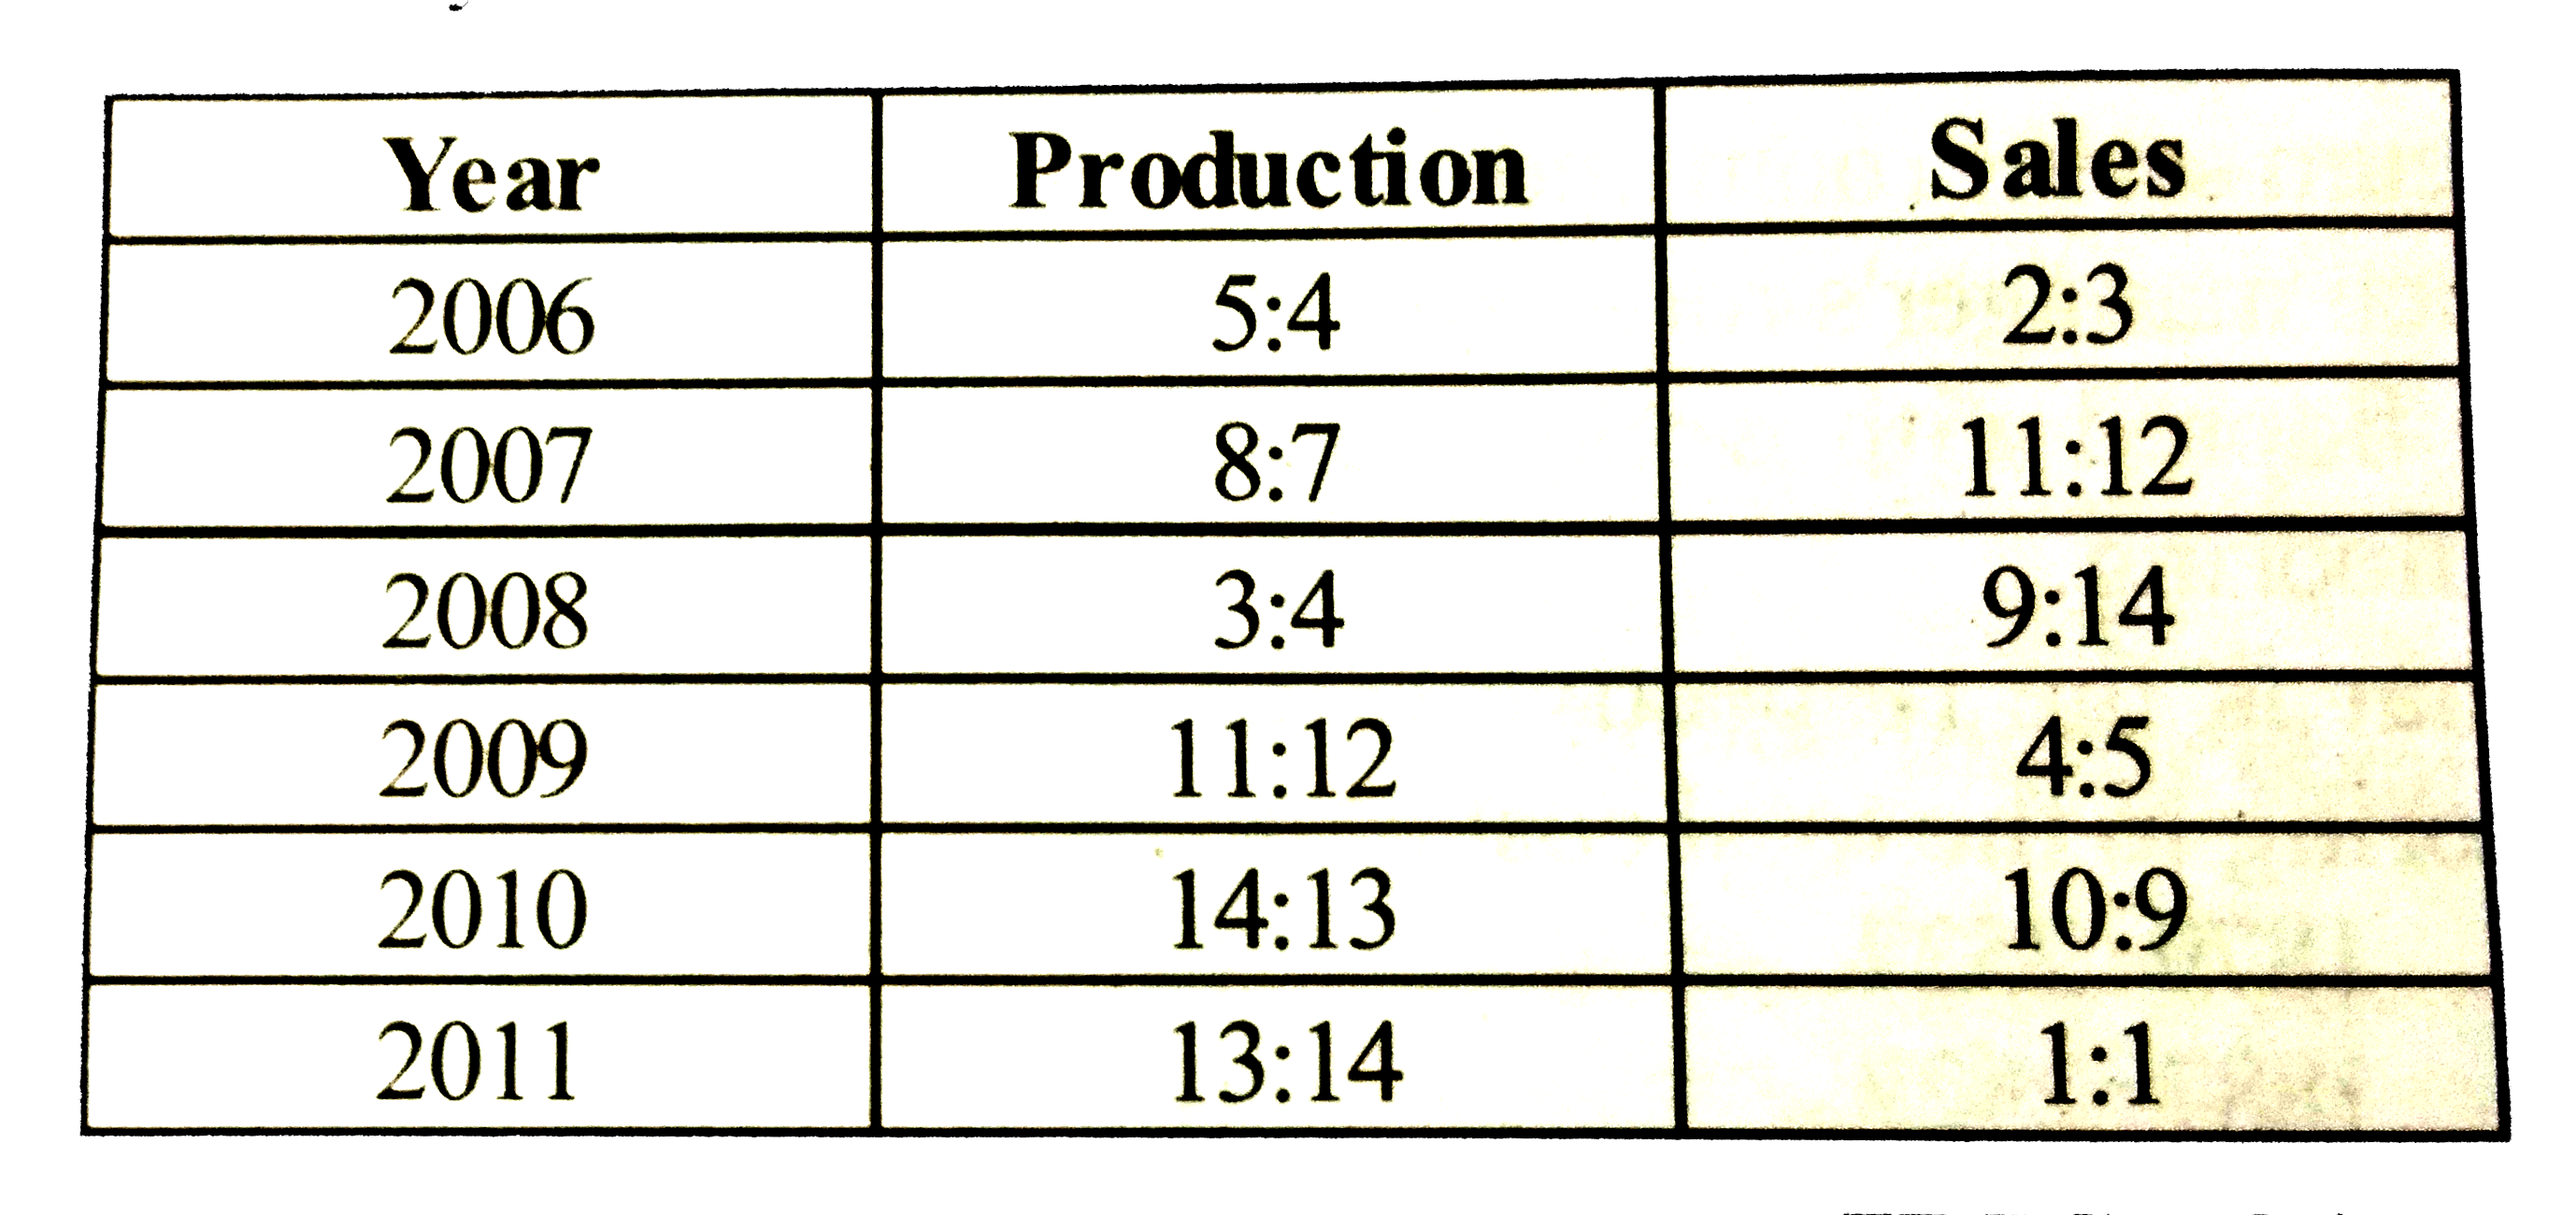
What is the respective ratio of the total production (in tonnes) of Company A to the total sales (in tonnes) of Company A?
View SolutionDirections (Questions 6-10): Study the following graph and answer the questions that follow: Production (in tonnes) and Sales (in tonnes) of Company A from 2006 to 2011 (FIGURE) The table given below represents the ratio of the production (in tonnes) of Company A to the production (in tonnes) of Company B and ratio of sales of Company A and Company B Year Production (A:B) Sales (A:B) 2006 5 : 4 2 : 3 2007 8 : 7 11 : 12 2008 3 : 4 9 : 14 2009 11 : 12 4 : 5 2010 14 : 13 10 : 9 2011 13 : 14 1 : 1 What is the approximate percentage increase in the production of Company A from 2009 to 2010? (a) 18% (b) 38% (c) 23% (d) 27% (e) 32%
View SolutionWhat is the average production of Company B (in tonnes) from the year 2006 to the year 2011? (a) 574 (b) 649 (c) 675 (d) 593 (e) 618
View SolutionThe line chart given below shows the sales (in crores) of a company for the years 2009 to 2016
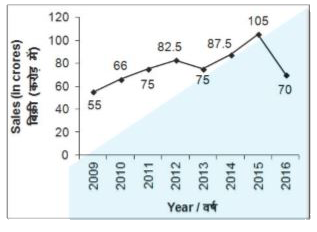
What is the percentage change in the company sales from year 2014 to year 2016?
View Solution
