The bar graph shows average marks scored in a 100 marks History exam by students of 7 divisions of Standard X. Study the diagram and answer the following questions.
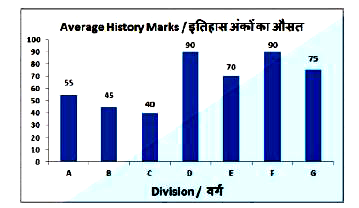
Marks of division F were greater than that of Division C by _________
125%
50%
55.5%
44.4%
The correct Answer is:A
Step by step video & image solution for The bar graph shows average marks scored in a 100 marks History exam by students of 7 divisions of Standard X. Study the diagram and answer the following questions. Marks of division F were greater than that of Division C by _________ by Maths experts to help you in doubts & scoring excellent marks in Class 14 exams.
Updated on:21/07/2023Similar Questions
The bar graph shows average marks scored in a 100 marks History exam by students of 7 divisions of Standard x. Study the diagram and answer the following questions.
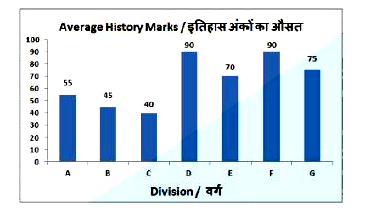
Which division scored the second lowest marks ?
View SolutionThe bar graph shows average marks scored in a 100 marks Science exam by student of 7 divisions of Standard X. Study the diagram and answer the following questions.
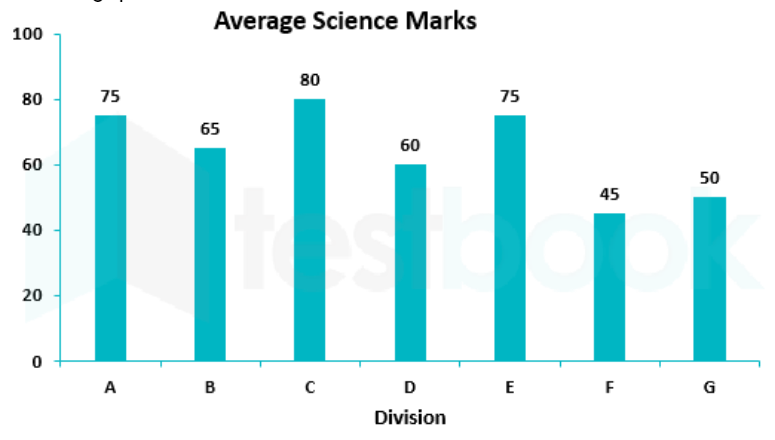
Which division scored the second lowest marks?
View Solution
Knowledge Check
The bar graph shows average marks scored in a 100 mark English exam by students of 7 divisions of standard X. Study the diagram and answer the following questions.
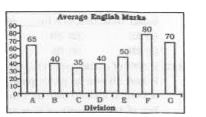
Marks of division F were greater than that of Division B by _____A50%B150%C200%D100%The bar graph shows average marks scored in a 100 mark Science exam by students of 7 divisions of Standard X. Study the diagram and answer the following questions.
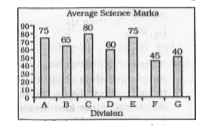
Marks of division F were lesser than that of Division C byA35%B47.25%C45%D43.75%The bar graph shows average marks scored in a 100 marks Geography exam by students of 7 divisions of Standard X. Study the diagram and answer the following questions.
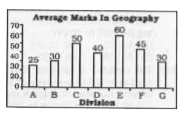
Average marks of divisions A were lesser than that of Division C by ______.A100%B150%C200%D50%
The bar graph shows average marks scored in a 100 marks History exam by students of 7 divisions of Standard x. Study the diagram and answer the following questions.
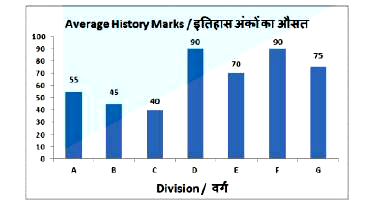
What is the ratio of average marks scored by Division D to Division G?
View SolutionThe bar graph shows average marks scored in a 100 marks History exam by students of 7 divisions of Standard X. Study the diagram and answer the following questions.
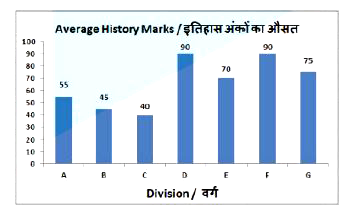
If all students of Division C lost 10 marks each for cheating in the test then their new average marks would decrease by how much?
View SolutionThe bar graph shows average marks scored in a 100 mark Science exam by students of 7 divisions of Standard X. Study the diagram and answer the following questions.

Marks of division F were lesser than that of Division C by
View SolutionThe bar graph shows average marks scored in a 100 mark English exam by students of 7 divisions of standard X. Study the diagram and answer the following questions.
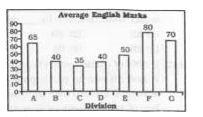
Which division scored the second highest average marks?
View SolutionThe bar graph shows average marks scored in a 100 mark English exam by students of 7 divisions of standard X. Study the diagram and answer the following questions.

Which division scored the second highest average marks?
View Solution
