The bar graph shows average marks scored in a 100 marks History exam by students of 7 divisions of Standard x. Study the diagram and answer the following questions.
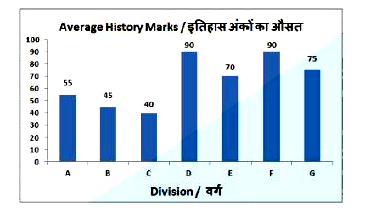
Which division scored the second lowest marks ?
C
F
D
B
The correct Answer is:D
Step by step video & image solution for The bar graph shows average marks scored in a 100 marks History exam by students of 7 divisions of Standard x. Study the diagram and answer the following questions. Which division scored the second lowest marks ? by Maths experts to help you in doubts & scoring excellent marks in Class 14 exams.
Updated on:21/07/2023Similar Questions
The bar graph shows average marks scored in a 100 marks Science exam by student of 7 divisions of Standard X. Study the diagram and answer the following questions.
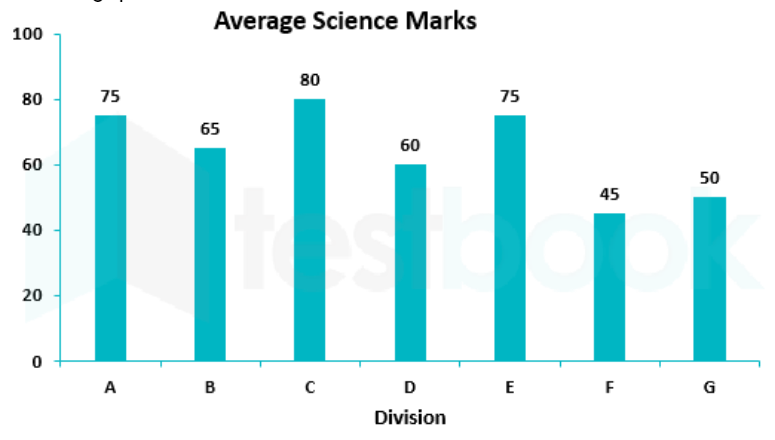
Which division scored the second lowest marks?
View SolutionThe bar graph shows average marks scored in a 100 marks History exam by students of 7 divisions of Standard X. Study the diagram and answer the following questions.
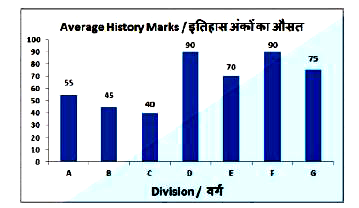
Marks of division F were greater than that of Division C by _________
View Solution
Knowledge Check
The bar graph shows average marks scored in a 100 mark Science exam by students of 7 divisions of Standard X. Study the diagram and answer the following questions.
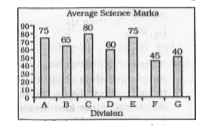
Marks of division F were lesser than that of Division C byAFBBCGDDThe bar graph shows average marks scored in a 100 mark English exam by students of 7 divisions of standard X. Study the diagram and answer the following questions.
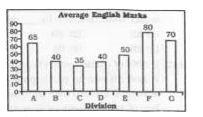
Which division scored the second highest average marks?AFBBCADCThe bar graph shows average marks scored in a 100 mark English exam by students of 7 divisions of standard X. Study the diagram and answer the following questions.

Which division scored the second highest average marks?AFBBCGDD
The bar graph shows average marks scored in a 100 marks History exam by students of 7 divisions of Standard x. Study the diagram and answer the following questions.
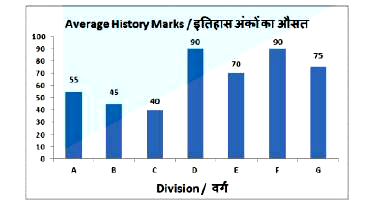
What is the ratio of average marks scored by Division D to Division G?
View SolutionThe bar graph shows average marks scored in a 100 marks History exam by students of 7 divisions of Standard X. Study the diagram and answer the following questions.
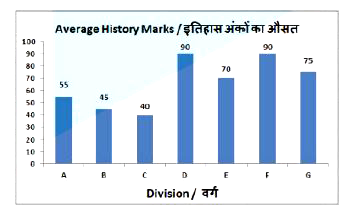
If all students of Division C lost 10 marks each for cheating in the test then their new average marks would decrease by how much?
View SolutionThe bar graph shows average marks scored in a 100 marks Geography exam by students of 7 divisions of Standard X. Study the diagram and answer the following questions.
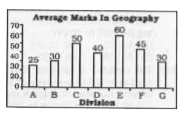
Average marks of divisions A were lesser than that of Division C by ______.
View SolutionThe bar graph shows average marks scored in a 100 mark English exam by students of 7 divisions of standard X. Study the diagram and answer the following questions.
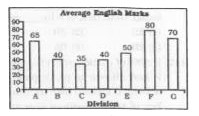
If all students of Division B got bonus of 5 marks each for winning an interschool match their new average marks would increase by how much?
View SolutionThe bar graph shows average marks scored in a 100 marks Geography exam by students of 7 divisions of Standard X. Study the diagram and answer the following questions.
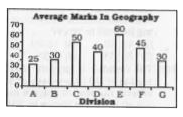
What is the ratio of average marks scored by Division C to Division G?
View Solution