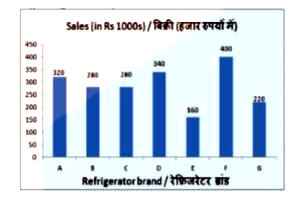
The bar graph shows 1 month's sales figure of different brands of refrigerator of a certain electronic store in Rs 1000s. Study the diagram and answer the following questions. 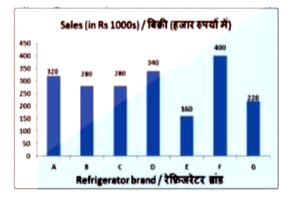
Sales of brand B was greater than that of brand E by ____.
1.50
0.75
2.40
1.20
The correct Answer is:A
Step by step video, text & image solution for The bar graph shows 1 month's sales figure of different brands of refrigerator of a certain electronic store in Rs 1000s. Study the diagram and answer the following questions. Sales of brand B was greater than that of brand E by ____. by Maths experts to help you in doubts & scoring excellent marks in Class 14 exams.
Similar Questions
The bar graph shows 1 month's sales figures of different brands of mobile phones of a certain electronics store in Rs 1000s. Study the diagram and answer the following questions.
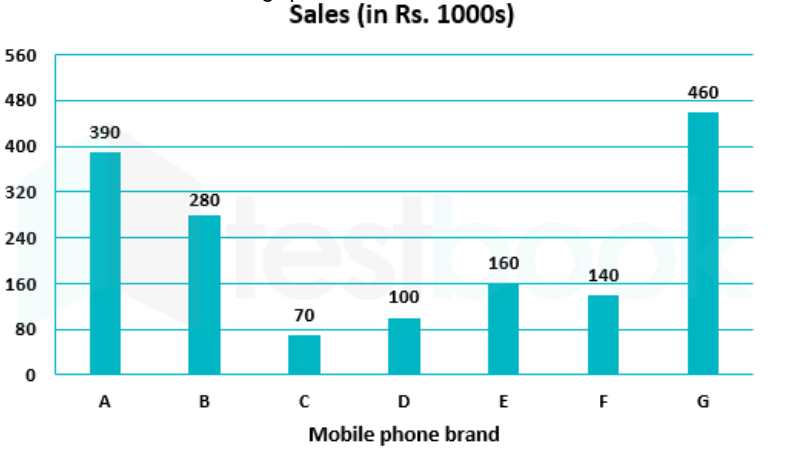
Sales of brand E was greater than that of brand D by ________.View SolutionThe bar graph shows 1 month's sales figures of different brands of televisions of a certain electonics store in Rs. 1000 s. study the diagram and answer the following questions.
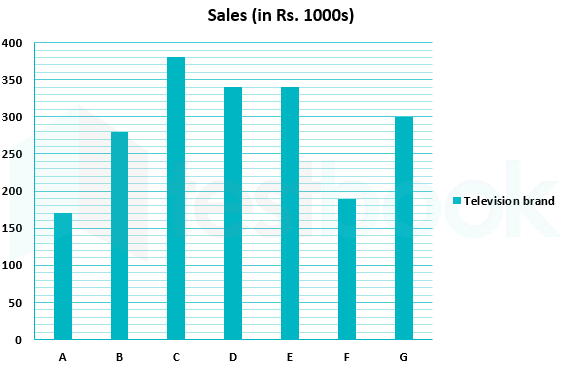
Sales of brand B was lesser than that of brand G byView Solution
Knowledge Check
- Question 1 - Select One
The bar graph shows 1 month's sales figure of different brands of refrigerator of a certain electronic store in Rs 1000s. Study the diagram and answer the following questions.

Sales of brand B was greater than that of brand E by ____.A1.50B0.75C2.40D1.20 - Question 2 - Select One
The bar graph shows 1 month's sales figure of different brands of refrigerator of a certain electronic store in Rs 1000s. Study the diagram and answer the following questions.

Sales of brand F was greater than that of brand E by ____.A1.5B0.5C2.4D0.6 - Question 3 - Select One
The bar graph shows 1 month's sales figures of different brands of washing machines of a certain electronics store in Rs 1000s. Study the diagram and answer the following questions.
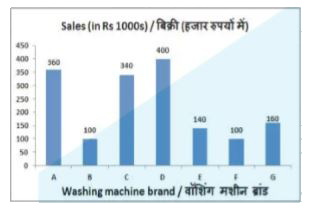
Sales of brand D was greater than that of brand B by ________.A300%B75%C100%D200%
The bar graph shows 1 month's sales figure of different brands of refrigerator of a certain electronic store in Rs 1000s. Study the diagram and answer the following questions.
What is the ratio of sales of brand B to that of brand E?View SolutionThe bar graph shows 1 month's sales figure of different brands of refrigerator of a certain electronic store in Rs 1000s. Study the diagram and answer the following questions.

What is the ratio of sales of brand B to that of brand E?View SolutionThe bar graph shows 1 month's sales figures of different brands of refriegerator of a certain electronic store in Rs 1000s. Study the diagram and answer the following questions.
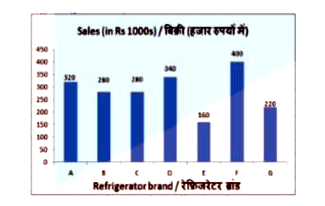
Sales of which refrigertor brand were the second highest?View SolutionThe bar graph shows 1 month's sales figures of different brands of refriegerator of a certain electronic store in Rs 1000s. Study the diagram and answer the following questions.

Sales of which refrigertor brand were the second highest?View SolutionThe bar graph shows 1 month's sales figure of different brands of refrigerator of a certain electronic store in Rs 1000s. Study the diagram and answer the following questions.
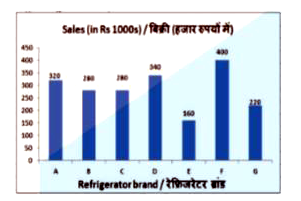
If the sales figures are exclusive of tax then at the rate of 5% tax how much is the tax to be paid (in Rs) on the sales of all the 7 brands of refrigerators?View Solution

