The bar graph shows 1 month's sales figures of different brands of televisions of a certain electonics store in Rs. 1000 s. study the diagram and answer the following questions.
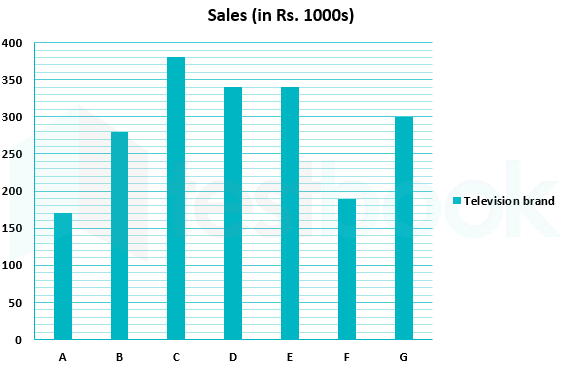
Sales of brand B was lesser than that of brand G by
0.0375
0.0667
0.0714
0.0525
Step by step video & image solution for The bar graph shows 1 month's sales figures of different brands of televisions of a certain electonics store in Rs. 1000 s. study the diagram and answer the following questions. Sales of brand B was lesser than that of brand G by by Maths experts to help you in doubts & scoring excellent marks in Class 14 exams.
Updated on:21/07/2023Similar Questions
The bar graph shows 1 month's sales figures of different brands of mobile phones of a certain electronics store in Rs 1000s. Study the diagram and answer the following questions.
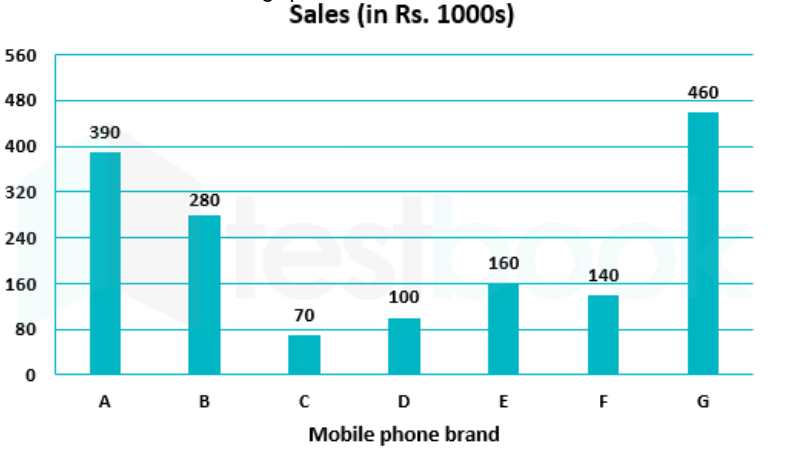
Sales of brand E was greater than that of brand D by ________.
View SolutionThe bar graph shows 1 month's sales figures of different brands of televisions of a certain electonics stone in Rs. 1000 s. study the diagram and answer the following questions.

What is the ratio of sales of brand E to that of brand A?
View Solution
Knowledge Check
The bar graph shows 1 month's sales figures of different brands of washing machines of a certain electronics store in Rs 1000s. Study the diagram and answer the following questions.
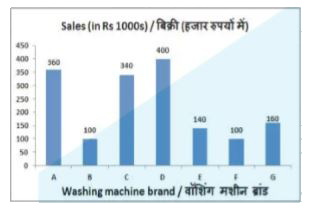
Sales of brand D was greater than that of brand B by ________.A300%B75%C100%D200%The bar graph shows 1 month's sales figure of different brands of refrigerator of a certain electronic store in Rs 1000s. Study the diagram and answer the following questions.
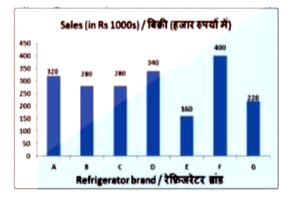
Sales of brand F was greater than that of brand E by ____.A1.5B0.5C2.4D0.6The bar graph shows 1 month's sales figure of different brands of refrigerator of a certain electronic store in Rs 1000s. Study the diagram and answer the following questions.

Sales of brand B was greater than that of brand E by ____.A1.50B0.75C2.40D1.20
The bar graph shows 1 month's sales figures of different brands of televisions of a certain electonics stone in Rs. 1000 s. study the diagram and answer the following questions.

Sales of which television brand were the second lowest?
View SolutionThe bar graph shows 1 month's sales figures of different brands of mobile phones of a certain electronics store in Rs 1000s. Study the diagram and answer the following questions.

What is the ratio of sales of brand 'B' to that of brand 'C'?
View SolutionThe bar graph shows 1 month's sales figure of different brands of refrigerator of a certain electronic store in Rs 1000s. Study the diagram and answer the following questions.
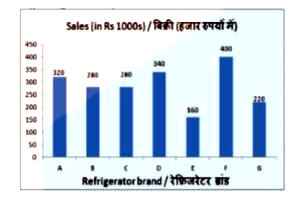
What is the ratio of sales of brand B to that of brand E?
View SolutionThe bar graph shows 1 month's sales figure of different brands of refrigerator of a certain electronic store in Rs 1000s. Study the diagram and answer the following questions.

What is the ratio of sales of brand B to that of brand E?
View SolutionThe bar graph shows 1 month's sales of different brands of washing machines of a certain electronics store in Rs. 1000s. Study the diagram and answer the following questions.
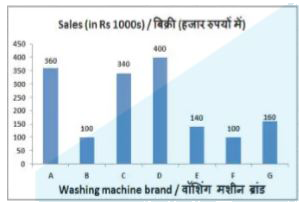
What is the ratio of sales of brand G to that of brand A?
View Solution
