The give graph shows the pass percentage of student taught by six teachers of a school in the Senior Secondary Board exam.
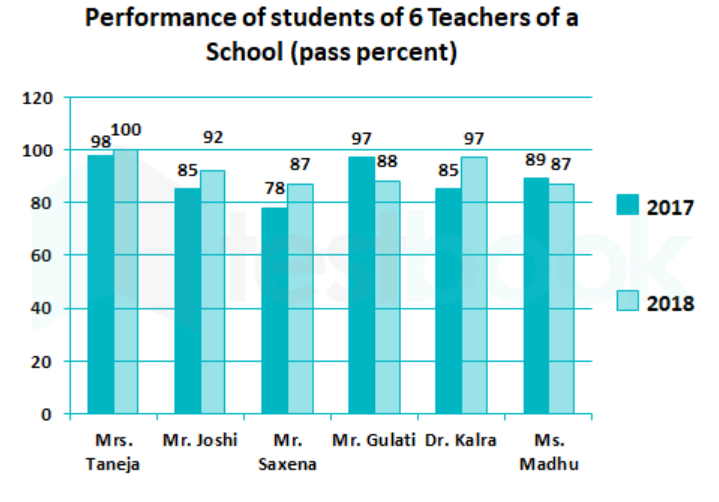
Identify the teacher whose students have shown the maximum improvement.
Mr. Joshi
Dr. Kalra
Mrs. Taneja
Mr. Saxena
The correct Answer is:B
Step by step video & image solution for The give graph shows the pass percentage of student taught by six teachers of a school in the Senior Secondary Board exam. Identify the teacher whose students have shown the maximum improvement. by Maths experts to help you in doubts & scoring excellent marks in Class 14 exams.
Updated on:21/07/2023Similar Questions
The given graph shows the pass percentage of students taught by six teachers of a school in the Senior Secondary Board exam. Identify the teacher whose students have shown the maximum improvement.
दिया गया आरेख छः शिक्षकों के द्वारा पढ़ाये गए छात्रों की उच्च माध्यमिक बोर्ड परीक्षा में उत्तीर्णता प्रतिशत को दर्शाता है।
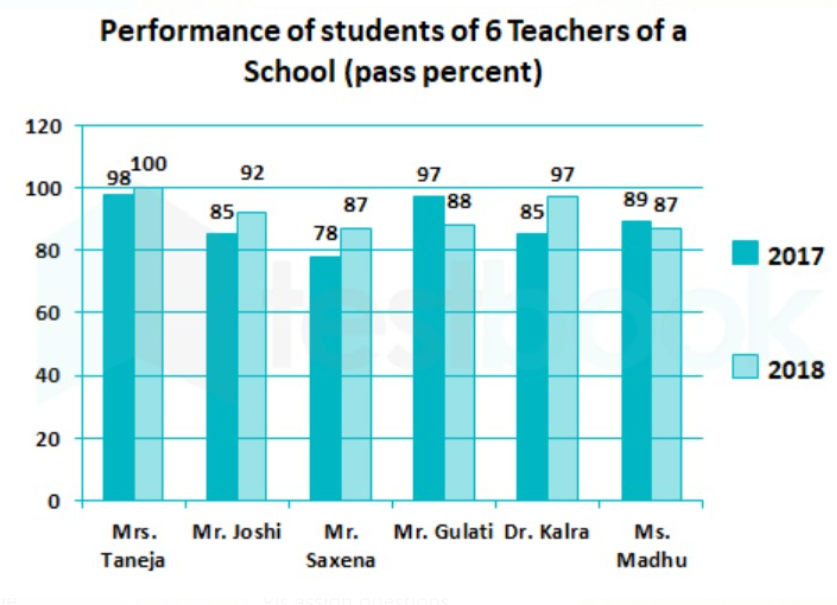
उस शिक्षक की पहचान कीजिए, जिसके छात्रों में सर्वाधिक सुधार देखने को मिला है ?
View SolutionThe given graph shows the pass percentage of students taught by six teachers of a school in ihe Senior Secondary Board exam.

Identify the teacher whose students have shown the maximum improvement.
View Solution
Knowledge Check
The given bar graph shows the number of students of two schools over a period of six years.
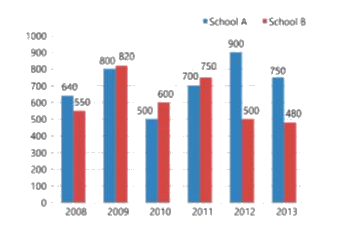
In the bar graph, what is the ratio of the average of the total students from school A to the average of the total students from school B ?A429:799B370:429C429:370D799:429The table given below shows the number of students who have taken admission in school A and B from the years 2010 to 2015.
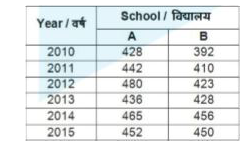
The difference between the number of students in both schools is maximum in which year?Aa)2010Bb)2012Cc)2014Dd)2015
Read the given bar graph, showing the number of games played by different number of students of a school.
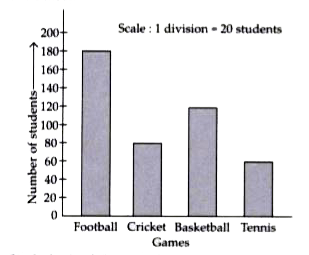
Which game is played by the maximum number of students ?
View SolutionThe given bar graph shows the number of students of two schools over a period of six years.
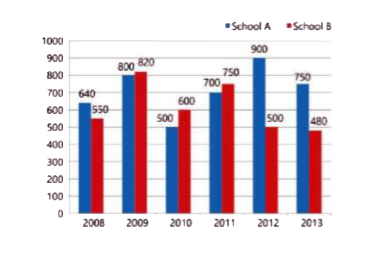
In the bar graph, what is the ratio of the average of total students from school B to the average of total students from school A?
View SolutionIn a board exam,the pass percentages of a certain school for the past three years are 87%,90% and 92%. If 400 students appear for the exam every year,then how many students have passed the exam in the past three years?
View SolutionIn a board exam,the pass percentages of a certain school for the past three years are 87%,90% and 92%. If 400 students appear for the exam every year,then how many students have passed the exam in the past three years?
View SolutionThe line graph shows the number of students of a certain university who passed in the given year in their final exams. Study the diagram and answer the following questions.
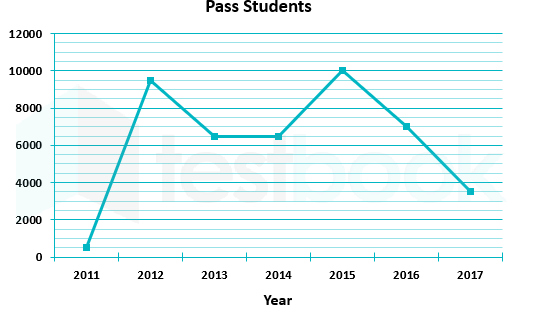
What was the difference in the number of students who passed between the years 2013 and 2016?
View SolutionThe given bar graph shows the number of students of two schools over a period of six years.
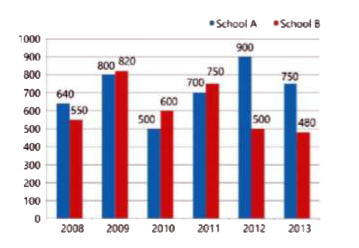
In the bar graph, in which year is the absolme difference of the students from schools A to B taken together, the maximum?
View Solution
