The following graph shows the number of boys and girls in Class V, Class VI, Class VII and Class VIII. Study the graph and answer the question.
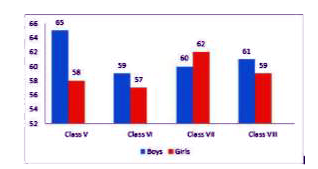
In which class, the percentage increase in the number of boys as compared to its previous class is least?
Class V
Class VIII
Class VI
Class VII
The correct Answer is:B
Step by step video & image solution for The following graph shows the number of boys and girls in Class V, Class VI, Class VII and Class VIII. Study the graph and answer the question. In which class, the percentage increase in the number of boys as compared to its previous class is least? by Maths experts to help you in doubts & scoring excellent marks in Class 14 exams.
Updated on:21/07/2023Similar Questions
The following graph shows the number of boys and girls in Class V, Class VI, Class VII and Class VIII. Study the graph and answer the question.
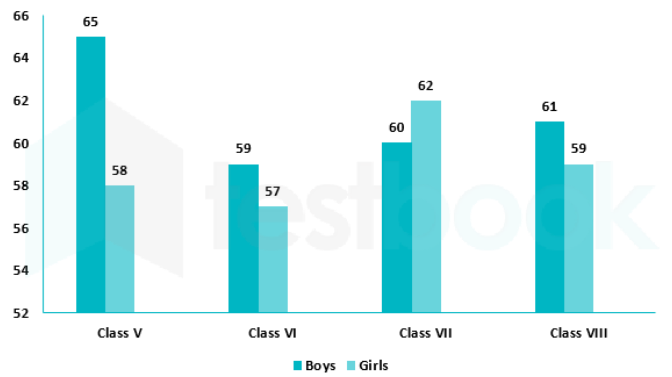
What class has the maximum number of students?
View SolutionThe following graph shows the number of boys and girls in Class V, Class VI, Class VII and Class VIII. Study the graph and answer the question.
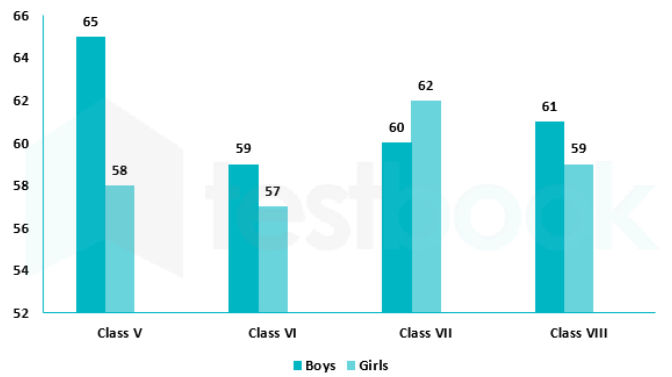
What is the average number of girls in all the classes?
View SolutionThe following graph shows the number of boys and girls in Class V, Class VI, Class VII and Class VIII. Study the graph and answer the question.
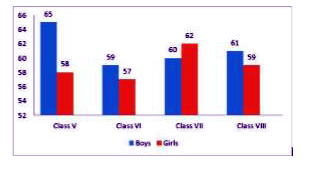
What is the overall percentage increase in boys when compared to girls? (Correct t two decimal places).
View SolutionThe following graph shows the number of boys and girls in class V, class VI, class VII and class VIII. Study the graph and answer the question.
निम्नलिखित आरेख कक्षा V, कक्षा VI, कक्षा VII और कक्षा VIII में लड़कों और लड़कियों की संख्या दर्शाता है। आरेख का अध्ययन करें और प्रश्न का उत्तर दें। In which class, the percentage increase in the number of boys as compared to its previous class is least?
किस कक्षा में लड़कों की संख्या में पिछले कक्षा की तुलना में प्रतिशत की वृद्धि सबसे कम है?
View SolutionThe following graph shows the number of boys and girls in class V, class VI, class VII and class VIII. Study the graph and answer the question.
निम्नलिखित आरेख कक्षा V, कक्षा VI, कक्षा VII और कक्षा VIII में लड़कों और लड़कियों की संख्या दर्शाता है। आरेख का अध्ययन करें और प्रश्न का उत्तर दें। What is the average number of girls in all the classes?
सभी कक्षाओं में लड़कियों की औसत संख्या क्या है?
View SolutionThe following graph shows the number of boys and girls in class V, class VI, class VII and class VIII. Study the graph and answer the question.
निम्नलिखित आरेख कक्षा V, कक्षा VI, कक्षा VII और कक्षा VIII में लड़कों और लड़कियों की संख्या दर्शाता है। आरेख का अध्ययन करें और प्रश्न का उत्तर दें। Which class has the maximum number of students?
किस कक्षा में छात्रों की अधिकतम संख्या है?
View SolutionThe following graph shows the number of boys and girls in class V, class VI, class VII and class VIII. Study the graph and answer the question.
निम्नलिखित आरेख कक्षा V, कक्षा VI, कक्षा VII और कक्षा VIII में लड़कों और लड़कियों की संख्या दर्शाता है। आरेख का अध्ययन करें और प्रश्न का उत्तर दें। What is the overall percentage increase in boys when compared to girls? (Correct to two decimal
places)
लड़कियों की तुलना में लड़कों में कुल प्रतिशत वृद्धि कितनी है? (दो दशमलव स्थानों के लिए)
View SolutionThe graph shows the result of 10th class students of a school for 4 years. Study the graph and answer the questions :
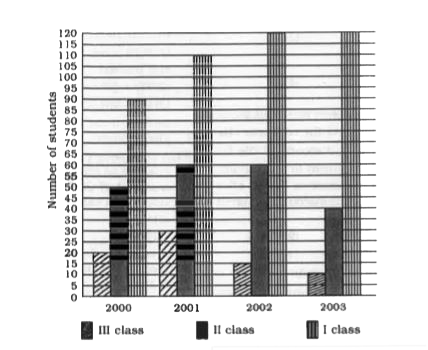
The percentage increase of first class in the year 2003 over the year 2002 is approximately
View SolutionThe following bar graph shows the number of students in different classes of a school.
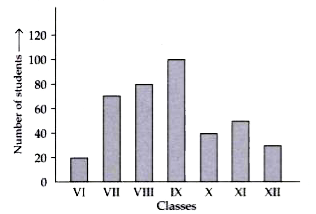
How many more students are there in Class IX than in Class VIII ?
View SolutionIn a class, there are 20 boys and 15 girls. What percentage of the number of boys is to the number of girls?
View Solution
