Study the graph and answer the question that follows.
The chart represents the demand and production of a certain item (in metric tonnes) for five companies U. V, X, Y and Z
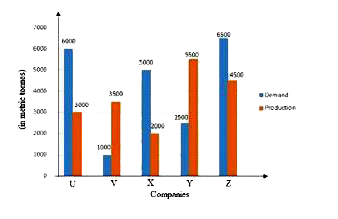
If p% of the demand of the item for company U is equal to the production for company Z. then p is equal to:
65
85
55
75
The correct Answer is:D
Step by step video, text & image solution for Study the graph and answer the question that follows. The chart represents the demand and production of a certain item (in metric tonnes) for five companies U. V, X, Y and Z If p% of the demand of the item for company U is equal to the production for company Z. then p is equal to: by Maths experts to help you in doubts & scoring excellent marks in Class 14 exams.
Similar Questions
The following graph shows the demand and production of cotton by 5 companies A, B, C, D and E. Study the graph and answer question
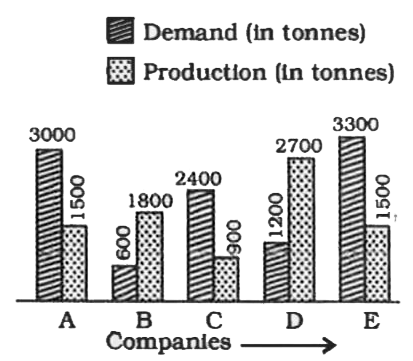
The production of company D is how many times that of the production of the company A?View SolutionThe following graph shows the demand and production of cotton by 5 companies A, B, C, D and E. Study the graph and answer question
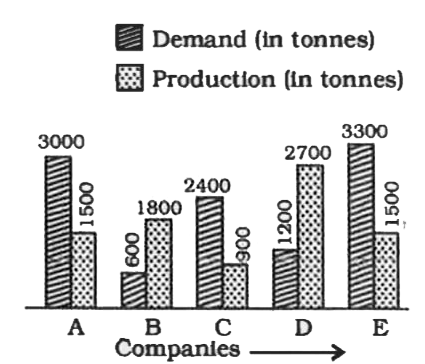
The demand for company B is what percent of the demand for comapny C?View Solution
Knowledge Check
- Question 1 - Select One
The following chart represents Demand and Production for 5 companies ABCDE. On the basis of the graph answer the questions.
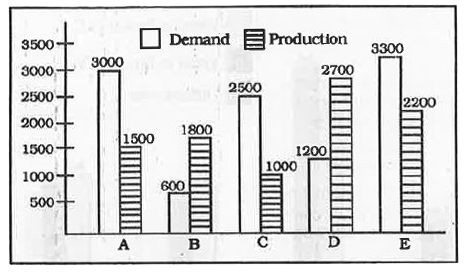
If the production of company D is h times of the production of company A. Then h equals :A1.5B2.5C1.2D1.8 - Question 2 - Select One
Study the following graph carefully and answer the questions -----
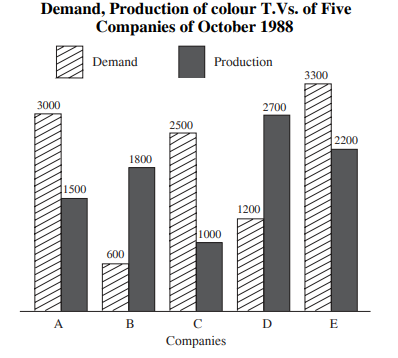
What is the difference between average demand and average production of the five companies taken together ?A1400B400C280D138 - Question 3 - Select One
The following chart represents Demand and Production for 5 companies ABCDE. On the basis of the graph answer the questions.
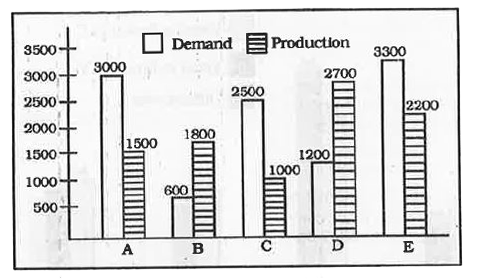
If x% of demand for company C equal demand for company B, then x equalsA24B20C60D4
Direction :- Study the graph and answer the questions.
Demand and Production of Colour TV Sets of Five companies A,B,C,D and E for October 2006
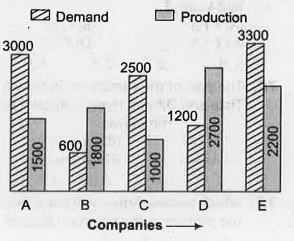
What per cent of the demand of company C is that of the company B?
(A) 14% (B) 20% (C) 24% (D) 26%View SolutionStudy the following graph carefully and answer the questions -----
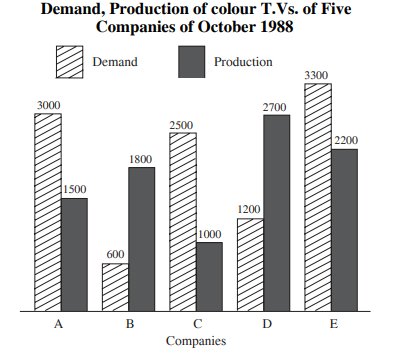
What is the ratio of companies having more demand than production to those having more production than demand ?View SolutionStudy the chart carefully and answer the questions
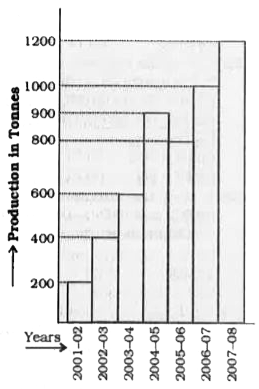
The chart shows production of an item (in tonnes) during certain years .
The production decreased from 2004-05 to 2205-06 byView SolutionStudy the chart carefully and answer the questions
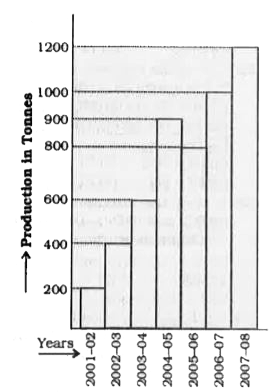
The chart shows production of an item (in tonnes) during certain years .
The production from 2003-04 to 2007-08 increased byView SolutionStudy the graph carefully and answer the questions.
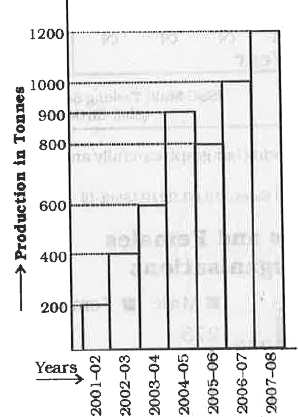
The graph shows production of an item (in tonnes) during certain years
The production from 2003-04 to 2007-08 increased byView Solution

