Study the following graph carefully and answer the questions -----
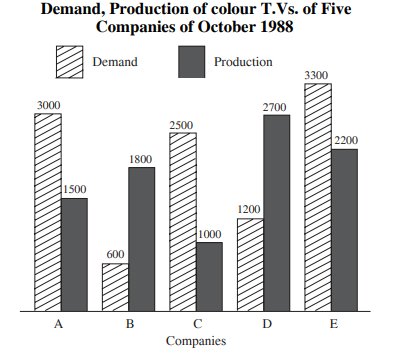
What is the ratio of companies having more demand than production to those having more production than demand ?
2 : 3
4 : 1
2 : 2
3 : 2
The correct Answer is:D
Step by step video, text & image solution for Study the following graph carefully and answer the questions ----- What is the ratio of companies having more demand than production to those having more production than demand ? by Maths experts to help you in doubts & scoring excellent marks in Class 14 exams.
Updated on:21/07/2023Topper's Solved these Questions
Similar Questions
The following graph shows the demand and production of cotton by 5 companies A, B, C, D and E. Study the graph and answer question
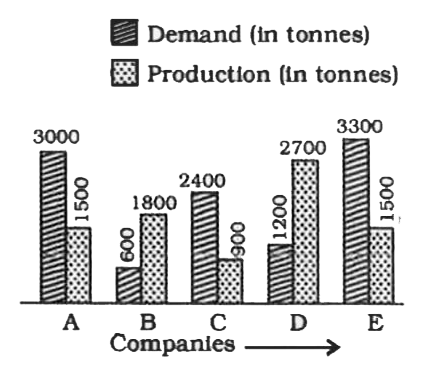
What is the ratio of companies having more demand than production to those having more production than demand?
View SolutionStudy the following graph carefully and answer the questions -----
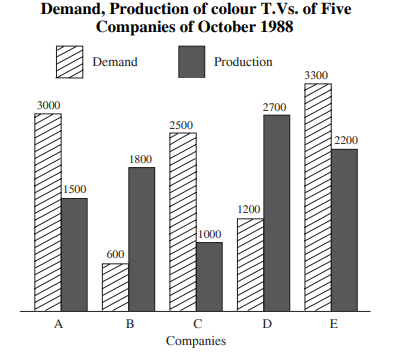
The production of company D is approximately how many times that of the production of the company A ?
View Solution
Knowledge Check
What is the ratio of the number of companies having more demand than production to the number of companies having more production than demand?
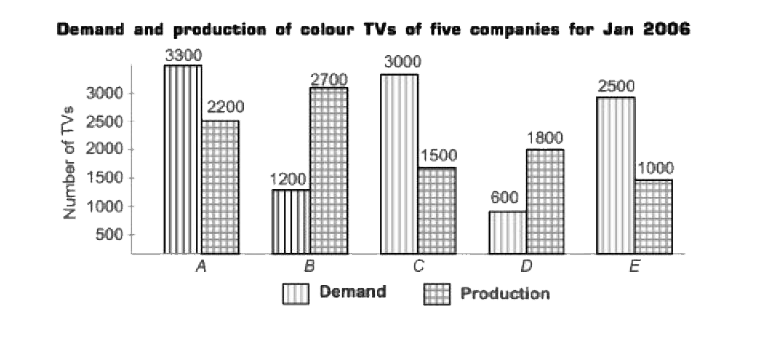 A2:3B4:1C2:2D3:2
The bar graph, given here, shows the demand and production of colour televisions of five companies for Diwali season in the year 2009. Study the graph carefully and answer the questions based on the graph.
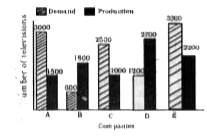
The ratio of companies having more demand than production of colour televisions to those having more production than demand is :A2:3B4:1C1:4D3:2Study the following graph carefully and answer the questions -----
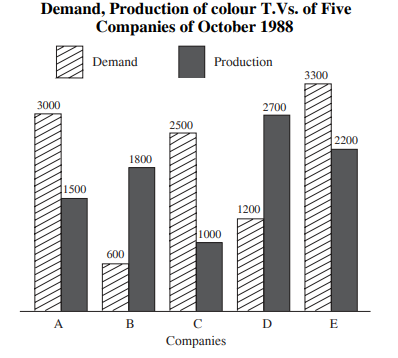
What is the difference between average demand and average production of the five companies taken together ?A1400B400C280D138
Study the following graph carefully and answer the questions that
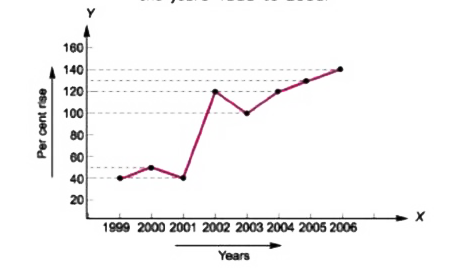
For how many years , the percent rise was more than 100 % ?
View SolutionStudy the following graph carefully and answer the questions that follow
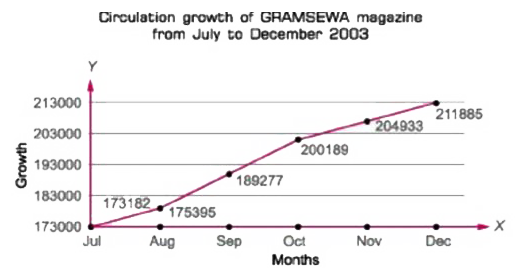
The circulation in October is ……. times than that of July .
View SolutionStudy the following graph carefully to answer these questions-
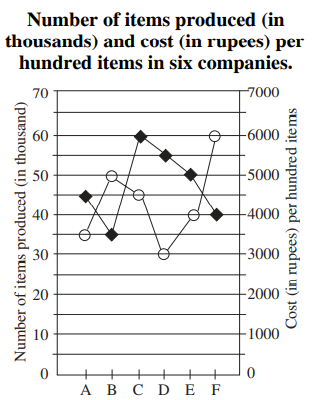
What is the average cost per hundred items for all the given companies?
View SolutionStudy the following graph carefully to answer these questions-
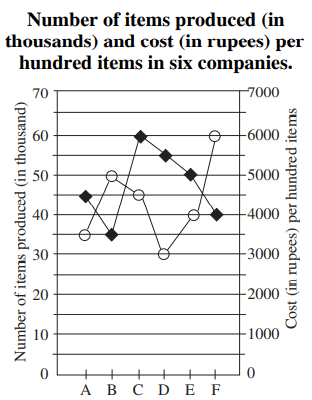
What is the total cost of items produced by companies A and B together?
View SolutionStudy the following graph carefully and answer the questions that follow
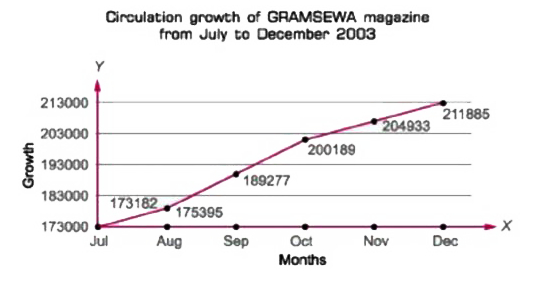
The circulation of magazine in November is …….. more than that of September
View Solution