Study the following graph and answer the questions given below: What is the average amount invested by Vivek in saving schemes A, B, C and D?
निम्नलिखित आरेख का अध्ययन करें और नीचे दिए गए प्रश्नों के उत्तर दें:
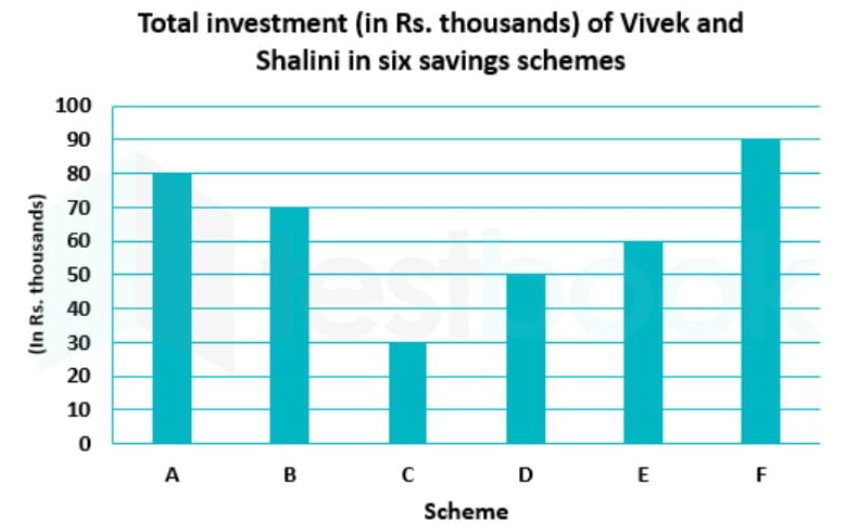
बचत योजनाओं A, B, C, D में विवेक द्वारा निवेश की गई औसत राशि क्या है?
₹ 27,200
₹ 28,500
₹ 27,250
₹ 27,000
Step by step video & image solution for Study the following graph and answer the questions given below: What is the average amount invested by Vivek in saving schemes A, B, C and D? निम्नलिखित आरेख का अध्ययन करें और नीचे दिए गए प्रश्नों के उत्तर दें: बचत योजनाओं A, B, C, D में विवेक द्वारा निवेश की गई औसत राशि क्या है? by Maths experts to help you in doubts & scoring excellent marks in Class 14 exams.
Updated on:21/07/2023Topper's Solved these Questions
Similar Questions
Study the following graph and answer the question given below :
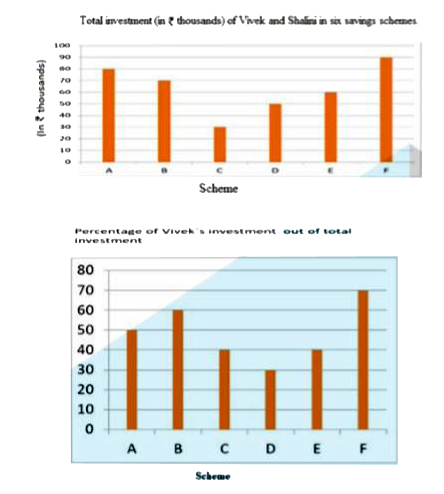
What is the average amount invested by Vivek in savings schemes A, B, C and D ?
View SolutionStudy the following graph and answer the question given below :
What is the ratio of the total amount invested by vivek in schemes A and C together to the total amount invested by Shalini in schemes A and C together ?
View Solution
Knowledge Check
Study the following bar diagram carefully and answer the following questions :
निम्नलिखित आरेख का ध्यानपूर्वक अध्ययन करें और दिए गए प्रश्नों का उत्तर दें:
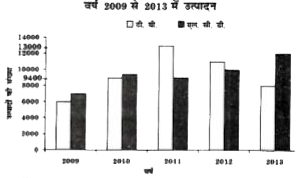
The ratio of production of TVs in the years 2009 and 2010 is.
वर्ष 2009 और 2010 में टी. वी. के उत्पादन का अनुपात -A(a)7:6B(b) 2:3C(c) 6:7D(d) 3:2Directions : Given here is a multiple bas digram of the scrors of four players in two innings. Study the digram and answer the questions.
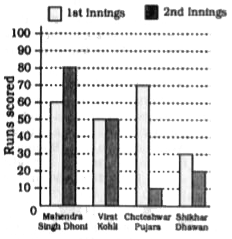
The average runs in two innings of the player who has scored minimum in the second inngins are :A75B70C80D85Given here is a multiple bar diagram of the scores of four players in two innings. Study the diagram and answer the questions %
The average score in second innings contributed by the four players is:
यहाँ चार खिलाड़ियों की दो पारियों के स्कोर का बहु बार-ग्राफ दिया गया है। आरेख का अध्ययन करें और प्रश्नों का उत्तर दें:
दूसरी पारी में चारों खिलाड़ियों का औसत स्कोर है
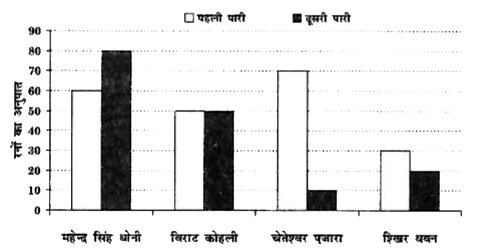 A50B60C40D30
Study the following Bar graph and answer the question. The Bar graph gives the annual rates of inflation in percentages for 1975 and 1987:
निम्नलिखित बार-ग्राफ का अध्ययन करें और प्रश्नों का उत्तर दें। बार-ग्राफ में वर्ष 1975 से 1987 तक प्रतिशत में मुद्रा स्फीति की वार्षिक दर प्रतिशत में दी गई है :
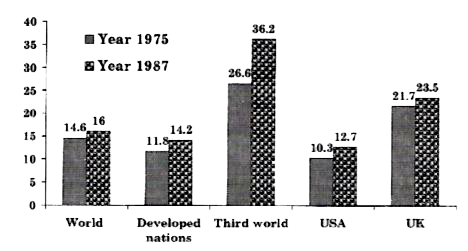
The change in rate of inflation was least in which of the following.
मुद्रास्फीति के परिवर्तन की निम्नतम दर इन में से कहाँ थी?
View SolutionStudy the following bar graph and answer the questions given below.
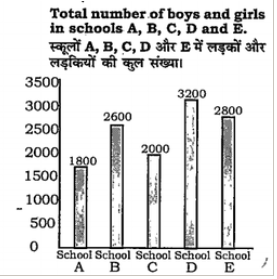
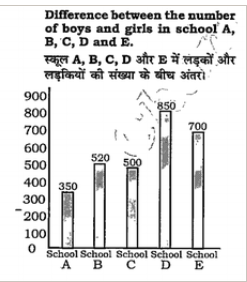 . The number of boys in school B
is what percentage of the number of students in that school?
निम्नांकित बार ग्राफ का अध्ययन कीजिए और उसके बाव दिए गए प्रश्न का उत्तर दीजिए।
 . स्कूल B में लड़कों की संख्या, उस स्कूल में
विद्यार्थियों की कुल संख्या की कितने प्रतिशत है?
View SolutionStudy the given graph and answer the question that follows:
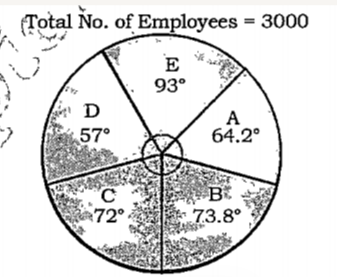
Breakup for distribution (degree wise) of the employees working in five departments (A,B,C,D, and E) in a company The number of employees in department B is what percent of the total number of employees working in department D and E?
दिए गए ग्राफ का अध्ययन करें और नीचे दिए गए प्रश्न का उत्त्तर दें। कंपनी के पांच विभागों (A, B, C, D और E) में काम कर रहे कर्मचारियों का वितरण
(डिग्री में) है। विभाग B में कर्मचारियों को संख्या, विभाग D और E में कार्य करने वाले कर्मचारियों की कुल संख्या की कितनी प्रतिशत है ?
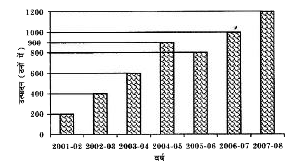
View SolutionStudy the chart carefully and answer the questions.
The chart shows production of an item (in tones) during certain years.
The production decreased from 2004-05 to 2005 - 06 by
निम्न आरेख का ध्यानपूर्वक अध्ययन कर दिए गए प्रश्नों के उत्तर दें:
आरेख किसी वर्ष के दौरान एक मद का उत्पादन (टनों में) दर्शाता है।
वर्ष 2004-05 से 2005-06 में उत्पादन में कितनी कमी हुई ?
View SolutionStudy the following bar graph and answer the questions given below.
निम्नांकित बार ग्राफ का अध्ययन कीजिए और उसके बाद दिए गए प्रशन का उत्तर दीजिए।
Total number of boys and girls in schools A, B, C, D and E.
स्कूलों A, B, C, D और E में लड़कों और लड़कियों की कुल संख्या।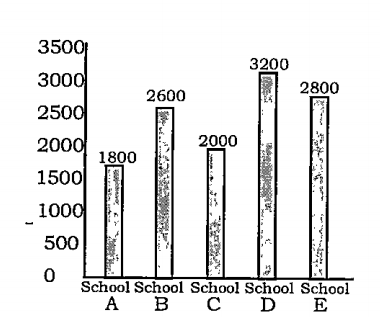
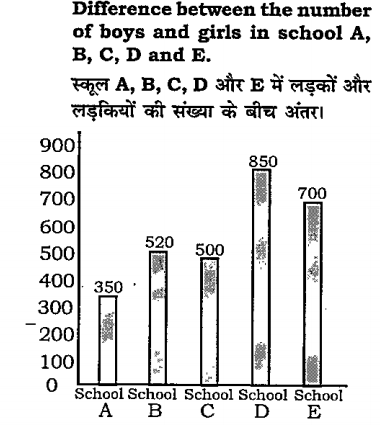
What is the difference between the number of girls in school A and the number of girls in school C?
स्कूल A में लड़कियों कीं संख्या और स्कूल C में लड़कों की संख्या में कितना अंतर है?
View Solution
