In a Radioactive decay Ak1−−→Bk2−−→C(K1>K2)
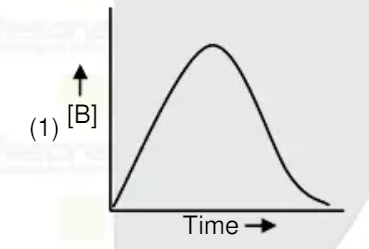
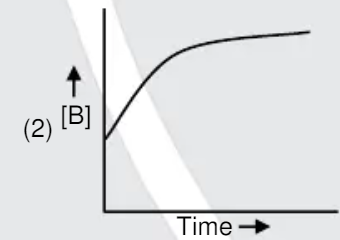
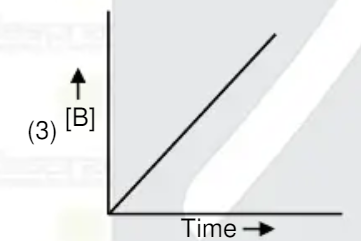
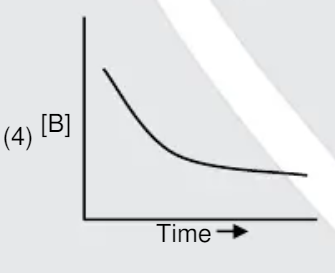
Initially B is not present, then correct curve for centration of B with respect to time is


To solve the problem of determining the correct curve for the concentration of B with respect to time during the radioactive decay process Ak1→Bk2→C, we can follow these steps:
Step 1: Understand the decay process
In this process, substance A decays into substance B at a rate k1, and substance B decays into substance C at a rate k2. Given that k1>k2, this indicates that B is formed more rapidly than it is converted into C.
Step 2: Analyze the initial conditions
Initially, the concentration of B is zero. As time progresses, B will begin to form as A decays. Since k1 is greater than k2, B will accumulate quickly at first.
Step 3: Determine the behavior of B over time
- Formation of B: Since k1 is larger, the concentration of B will rise rapidly as A decays.
- Decomposition of B: However, B will also start to decay into C, but at a slower rate because k2 is smaller than k1. This means that while B is being formed quickly, it will not decompose as quickly.
Step 4: Sketch the concentration curve
1. Initial Phase: At time t=0, the concentration of B is zero.
2. Increasing Phase: As time progresses, the concentration of B increases rapidly due to the faster formation from A.
3. Plateau Phase: Eventually, the rate of formation of B will start to balance out with the rate of its decay into C, leading to a slower increase and then a plateau.
4. Decreasing Phase: After reaching a maximum, the concentration of B will begin to decrease slowly as it decays into C.
Step 5: Identify the correct graph
Based on the analysis, the correct graph will show:
- A rapid increase in the concentration of B initially.
- A gradual leveling off as it reaches a maximum.
- A slow decrease after reaching the peak.
This behavior matches with Option 1 from the given choices.
Final Answer:
The correct curve for the concentration of B with respect to time is represented by Option 1.
---
In this process, substance A decays into substance B at a rate k1, and substance B decays into substance C at a rate k2. Given that k1>k2, this indicates that B is formed more rapidly than it is converted into C.
Initially, the concentration of B is zero. As time progresses, B will begin to form as A decays. Since k1 is greater than k2, B will accumulate quickly at first.
- Formation of B: Since k1 is larger, the concentration of B will rise rapidly as A decays.
- Decomposition of B: However, B will also start to decay into C, but at a slower rate because k2 is smaller than k1. This means that while B is being formed quickly, it will not decompose as quickly.
1. Initial Phase: At time t=0, the concentration of B is zero.
2. Increasing Phase: As time progresses, the concentration of B increases rapidly due to the faster formation from A.
3. Plateau Phase: Eventually, the rate of formation of B will start to balance out with the rate of its decay into C, leading to a slower increase and then a plateau.
4. Decreasing Phase: After reaching a maximum, the concentration of B will begin to decrease slowly as it decays into C.
Based on the analysis, the correct graph will show:
- A rapid increase in the concentration of B initially.
- A gradual leveling off as it reaches a maximum.
- A slow decrease after reaching the peak.
The correct curve for the concentration of B with respect to time is represented by Option 1.
Similar Questions
In the sequence of reaction
AK1−−→BK2−−→CKc−−→D,K3>K2>K1 then the rate determining step of the reaction is
View SolutionIn the following first order competing reactions Ak1−−→B,Ck2−−→D. If only 50% of A have been reacted whereas 94% of C has been reacted in the same time interval then find the ratio of k2k1.
View Solution
Knowledge Check
For a reaction schemeAk1−−→Bk2−−→C , if the rate of formation of B is set to be zero then the concentration of B is given by :
A(k1+k2)[A]B(k1+k2)[A]Ck1k2[A]D(k1k2)[A]In the given sequence of first order reaction,
Ak1−−→Bk2−−→k3−−→D
What is the ratio of numbers of atoms of A to the number of atoms of B after long time interval starting with pure A, where k1 where K1 k1=In220×60,k2=In230?A23B10C20D40Statement -1: In Ak1−−→Bk2−−→C
If half life of A is very less as compared to B, then, net reaction is A to C with rate constant (k1×k2)
Statement-2: Slowest step is the rate determining step si B to C is rate determining step.AStatement-1 is True, statement-2 is True, Statement-2 is a correct explantion for Statement-1.BStatement-1 is True, Statement-2 is True, Statement-2 is NOT a correct explanation for Statement-1CStatement-1 is True, Statement-2 is False.DStatement-1 is False, Statement-2 is True.
A consecutive reaction, AK1−−→BK2−−→C is characterised by:
View SolutionAK1−−→BK2−−→C if all the reaction are 1st order and d[B]dt=0. Determine [B].
View SolutionA reaction is represented by Ak1−−→B (slow ) and A+Bk2−−→C (fast) where k1 and k2 are the ratge constants of two steps. The rate of production of C will be given by
View SolutionFor the consecutive unimolecular-type first-order reaction Ak1−−→Rk2−−→S, the concentration of component R, CR at any time t is given by -
CR=COAK1[e−k1t(k2−k1)+e−k2t(k1−k2)]
if CA=CAO,CR=CRO=0 at t=0
The time at which the maximum concentration of R occurs is -
View SolutionFor the reaction AK1⇐===⇒K2B, if 'a' is the initial concentration of A and n is the number of moles of A reacting if initially no B was present then :
View Solution
