The bar graph shows results of a survey carried out within a health club. The members of the club were asked which energy drink they consumed? Study the diagram and answer the following question.
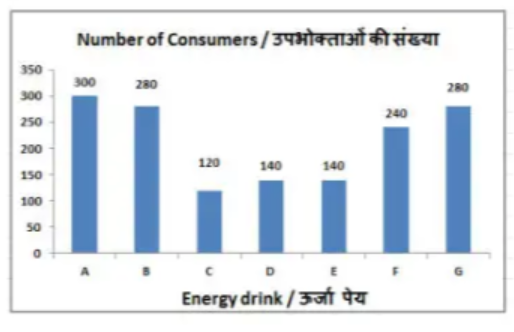
consumers of drink B are greater than that of drink E by_____.
50%
100%
200%
150%
The correct Answer is:B
Step by step video & image solution for The bar graph shows results of a survey carried out within a health club. The members of the club were asked which energy drink they consumed? Study the diagram and answer the following question. consumers of drink B are greater than that of drink E by_____. by Maths experts to help you in doubts & scoring excellent marks in Class 14 exams.
Updated on:21/07/2023Similar Questions
The bar graph shows results of a survey carried out within a health club. The members of the club were asked which energy drink they consumed? Study the diagram and answer the following question.
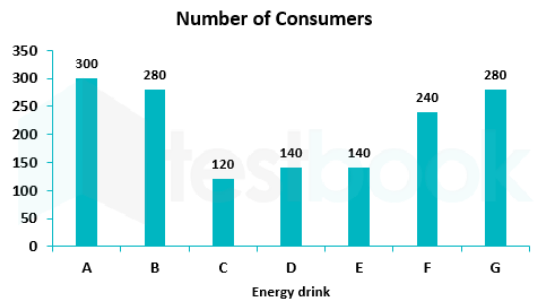
Which energy drink was consumed the least?
View SolutionThe bar graph shows results of a survey carried out within a health club. The members of the club were asked which energy drink they consumed? Study the diagram and answer the following question.

If 40% of consumers of drink C start consuming drink F then the consumers of drink F would increase by_____.
View Solution
Knowledge Check
The bar graph shows results of a survey. 1500 people exiting multiplex were asked which movie they watched? Study the diagram and answer the following questions?
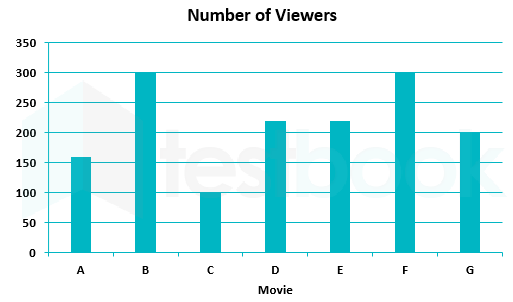
Which movie had least number of viewers?ACBFCADGThe bar graph shows results of a survey. 1500 people exiting multiplex were asked which movie they watched? Study the diagram and answer the following questions?
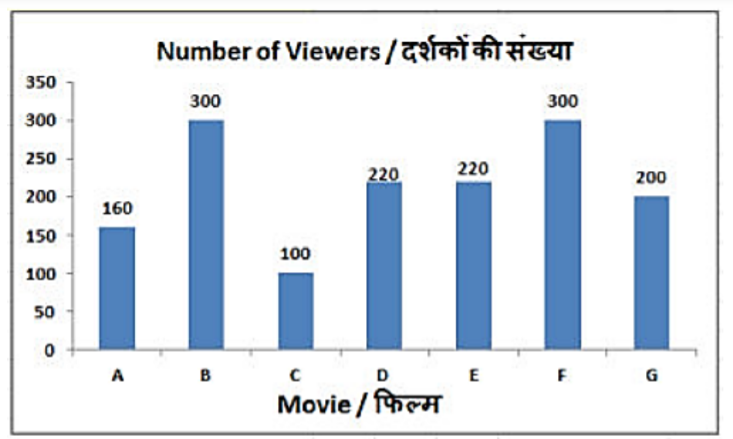
What is the ratio of viewers of movie B to Viewers of movie A?Aa.8:15Bb.2:1Cc.15:8Dd.1:2The line graph shows the number of deaths due to road accidents in a certain state. Study the diagram and answer the following questions.
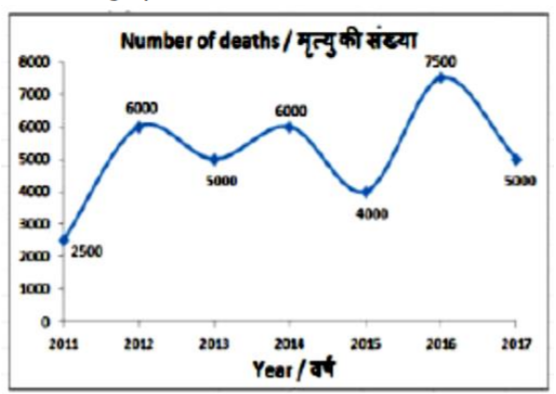
The number of deaths in 2014 were greater than that in 2017 by ________.Aa. 50%Bb. 40%Cc. 20%Dd. 14.2%
The bar graph shows results of a survey carried out within a health club. The members of the club were asked which energy drink they consumed? Study the diagram and answer the following question.

What is the ratio of consumers of energy drink C to consumers of energy drink G?
View SolutionThe line graph shows the Sales per employee of a certain company. Study the diagram and answer the following questions.
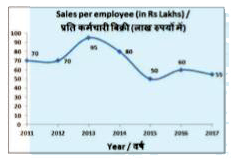
The Sales per employee in 2012 were greater than that in 2015 by _______.
View SolutionThe line graph shows the number of deaths due to rail accidents in a certain state. Study the diagram and answer the following questions.
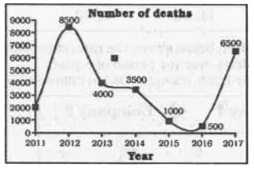
The number of deaths in 2017 was greater than that in 2013 by ____.
View SolutionThe bar graph shows the population of different countries. Study the diagram and answer the following questions.
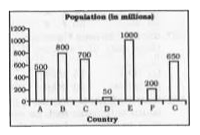
Population of country E is greater than that of country A by _____.
View SolutionThe bar graph shows the number of soldiers in the armies of different countries. Study the diagram and answer the following questions.
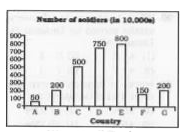
The number of soldiers of country F is greater than that of country A by ____.
View Solution
