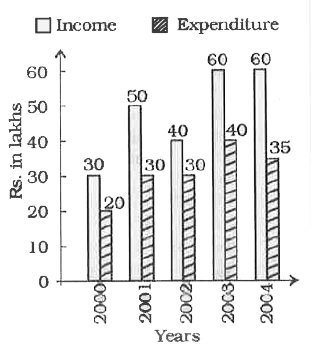
The graph shows Income and Expenditure of a company. Study the graph and answer the questions.
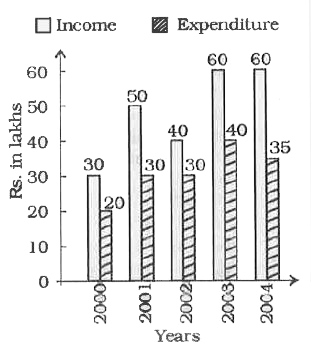
The income in 2002 was equal to the expenditure in the year
2003
2004
2000
2001
The correct Answer is:A
Step by step video & image solution for The graph shows Income and Expenditure of a company. Study the graph and answer the questions. The income in 2002 was equal to the expenditure in the year by Maths experts to help you in doubts & scoring excellent marks in Class 14 exams.
Updated on:21/07/2023Similar Questions
In the given bar graph, the white bar shows the income and the black bar shows the expenditure of a company. Study the graph and answer the question that follows.
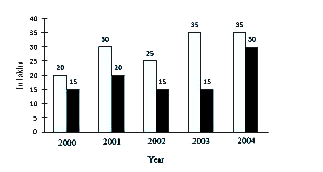
The income in 2001 was equal to the expenditure in the year :
View SolutionThe graph shows Income and Expenditure of a company. Study the graph and answer the questions.
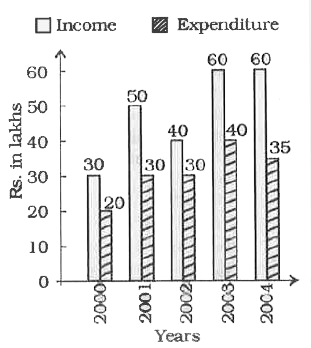
The profit was maximum in the year
View Solution
Knowledge Check
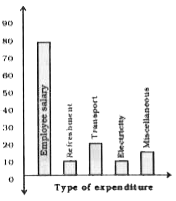
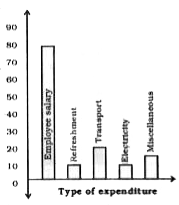
The bar diagram shows the monthly expenditure of a company. Study the graph and answer the questions.
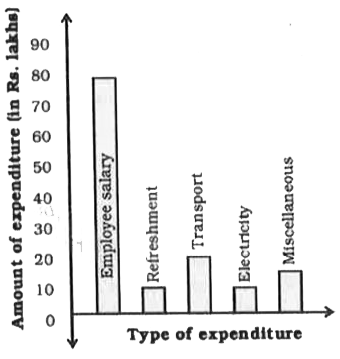
The total monthly expenditure of the company is :ARs. 153 lakhsBRs. 315 lakhsCRs. 135 lakhsDRs. 531 lakhsThe bar diagram shows the monthly expenditure of a company. Study the graph and answer the questions.
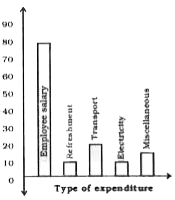
The total monthly expenditure of the company is :ARs. 153 lakhsBRs. 315 lakhsCRs. 135 lakhsDRs. 531 lakhsThe bar diagram shows the monthly expenditure of a company. Study the graph and answer the questions.
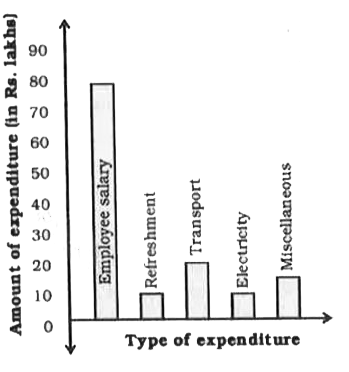
The ratio between expenditure on transport and employee salary on monthly basis is :A1:4B4:3C3:4D4:1
The graph shows Income and Expenditure of a company. Study the graph and answer the questions.
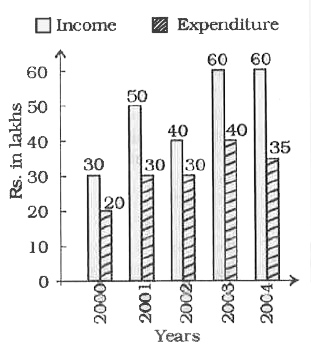
The expenditure from 2002 to 2003 increased by
View SolutionThe graph shows Income and Expenditure of a company. Study the graph and answer the questions.
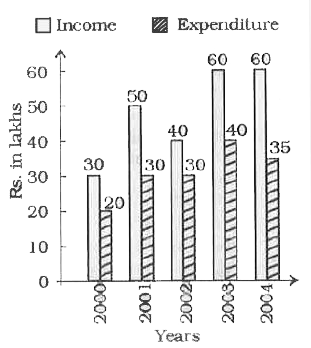
The difference in profit between 2001 and 2002 is
View SolutionThe graph shows Income and Expenditure of a company. Study the graph and answer the questions.
The number of years in which the income exceeds the average income is
View SolutionThe bar diagram shows the monthly expenditure of a company. Study the graph and answer the questions.
The ratio between expenditure on transport and employees salary on monthly basis is :
View SolutionThe bar diagram shows the monthly expenditure of a company. Study the graph and answer the questions.
The fraction of money spent on refreshment is :
View Solution
