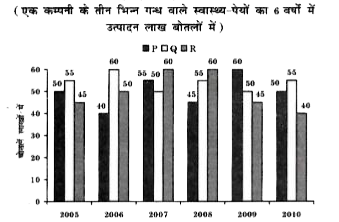
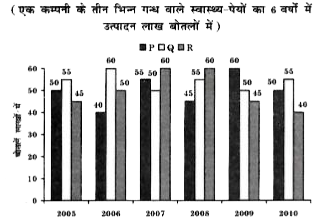
The average annual production of which flavour was maximum in the given period?
दी गई पूरी अवधि में किस गन्ध का औसत वार्षिक उत्पादन अधिकतम रहा है?
A. P and R both/P तथा R दोनों
B. only P/केवल P
C. P and Q both/P तथा Q दोनों
D. only Q/केवल Q
The correct Answer is:D
गन्ध P का औसत उत्पादन
=50+40+55+45+60+456=49.17
गन्ध Q का औसत उत्पादन
55+60+50,55+50+556= 54.17
गन्ध R का औसत उत्पादन = 45+50+60+60+45+406 = 50
अर्थात् गन््ध Q का औसत वार्षिक उत्पादन सर्वाधिक रहा है|
Similar Questions
In the following table, the production of various crops (in tonnes) is given from 2015 to 2019. Study the table and answer the question that follows:
दी गयी तालिका में, 2015 से 2019 तक विभिन्न फसलों का उत्पादन (टन में ) दिया गया है | इस तालिका का अध्ययन करें तथा फिर पूछे गए प्रश्न का उत्तर दीजिए |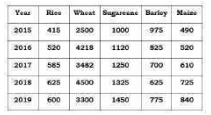 The average production of wheat (in tonnes) in the period given in the table is:
तालिका में दी गयी अवधि में गेहूँ का औसत उत्पादन ( टन में ) कितना रहा है ?View SolutionThe bar chart shows the annual food grain production (in million tonnes) for years 2012-2017. For how many years is the production less than the average production during the given period?
यह दंड आरेख वर्ष 2012-2017 की अवधि में वार्षिक खाद्यान्न उत्पादन (मिलियन टन में ) को दर्शाता है | कितने वर्ष उत्पादन इस अवधि के औसत उत्पादन से कम है ?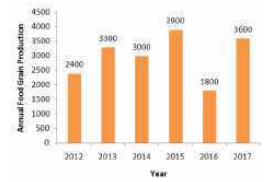 View Solution
Knowledge Check
- Question 1 - Select One
When average product of an input is at its maximum then
(AP = Average product)
(MP = Marginal Product )
जब किसी निवेश का औसत उत्पाद अपने अधिकतम पर हो, तो
(औसत उत्पाद)
(सीमांत उत्पाद)AAP=0BAP=MPCAP>MPDAP<MP - Question 2 - Select One
A health drink company prepares the drink of three different flavours P, Q, R. The production of three flavours over a period of six years has been expressed on bar graph provided below. Study the graph and answer the questions.
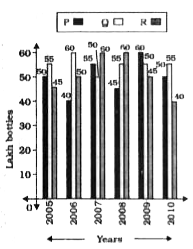
The average annual production of which flavour was maximum in the given period ?AP and Q bothBO onlyCP and R bothDP only - Question 3 - Select One
A health drink company prepares the drinks of three different flavours P, Q, R. The production of three flavours over a period of six years has been expressed on bar graph provided below. Study the graph and answer the questions.
(Production of 3 different flavours of health drinks of a company in 6 years in Lakh bottles)
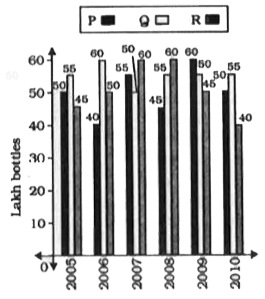
The average annual production of which flavour was maximum in the given period ?AP and Q bothBQ onlyCP and R bothDP only
The average Kharif production of the given years is-
दिए गए वर्षों में खरीफ का फसलों का औसत उत्पादन कितना है?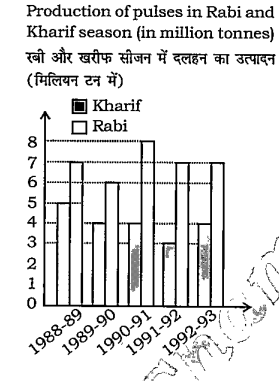 View Solution
Study the graph and answer the questions.
ग्राफ का अध्ययन कीजिए और दिये गये प्रश्नों के उत्तर दीजिए:
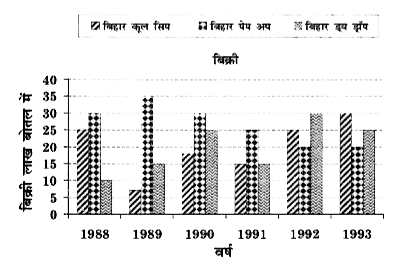
In case of which soft drink was the average annual sale maximum during the period 1988-1993 ?
किस सॉफ्ट ड्रिंक के मामले में, 1988-1993 की अवधि में औसत वार्षिक बिक्री अधिकतम थी?View SolutionStudy the given chart carefully and answer the question accordingly:
दिए गए चार्ट का ध्यानपूर्वक अध्ययन करें और उसके अनुसार प्रश्न का उत्तर दें: In which of the following years was the percentage increase in production from the previous year, the maximum among the given years?
पिछले वर्ष की तुलना में निम्नलिखित वर्षों में से किस वर्ष में उत्पादन में अधिकतम प्रतिशत वृद्धि हुई?View SolutionThe bar graph given below shows the maximum temperature (^∘C) of a city for ten days in different months.
नीचे दिया गया दण्ड आरेख किसी शहर के विभिन्न मासों में 10 भिन्न दिनों के अधिकतम तापमान (^∘C) को दर्शाता है |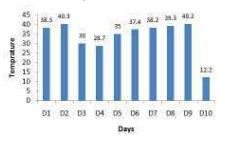 What is the average per day maximum temperature of the city for the given period of ten days ?
दिए गए दस दिनों के लिए प्रतिदिन शहर का औसत अधिकतम तापमान कितना है ?View SolutionIn which of the following years the percentage of rise or fall in production from the previous year is maximum for the flavour of Q ?
निम्न में से किस वर्ष में, पिछले वर्ष की तुलना में गन्ध Q के उत्पादन में वृद्धि या हास अधिकतम रहा है?
 View Solution

