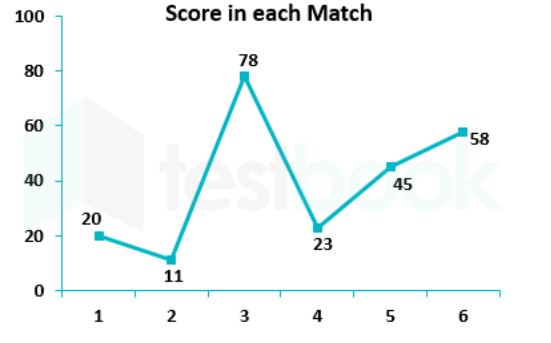
The line graph shows the scores of a batsman in 6 consecutive matches. What is his batting average in the 6 matches?
37.19
38.33
38.17
39.17
The correct Answer is:D
Step by step video & image solution for The line graph shows the scores of a batsman in 6 consecutive matches. What is his batting average in the 6 matches? by Maths experts to help you in doubts & scoring excellent marks in Class 14 exams.
Updated on:21/07/2023Similar Questions
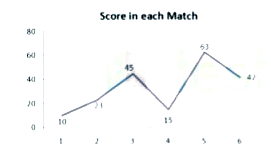
The line graph shows the scores of a batsman in 6 consecutive matches. What is the range of his scores?
View SolutionThe given bar graph presents the runs scored and strike rate of a batsman in five matches , Strike rate is the number of runs scored per 100 balls faced. The strike rate is taken on record only when the batsmen scores at least 30 runs in a match
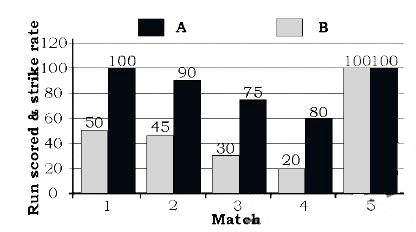
What is the average strike rate of the batsman
View Solution
Knowledge Check
Which Indian batsman made three consecutive centuries in his first three Test matches?
AVinoo MankadBG.R. VishwanathCMohd. AzaruddinDMS. M. GavaskarThe given Bar Graph presents the runs scored (A) and strike rate (B) of a batsman in five matches. Strike Rate is the number of runs scored per 100 balls faced. The strike rate (B) is taken on record only when the batsman scores at least 30 runs in a match.
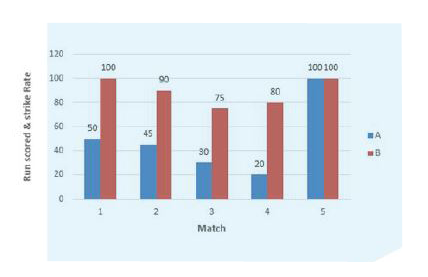
How many runs the batsman should have scored in the fifth match in as many balls he had faced in that match so that the average strike rate of the second and the fifth match becomes 120?A150B160C120D240The given Bar Graph presents the runs scored (A) and strike rate (B) of a batsman in five matches. Strike Rate is the number of runs scored per 100 balls faced. The strike rate (B) is taken on record only when the batsman scores at least 30 runs in a match.
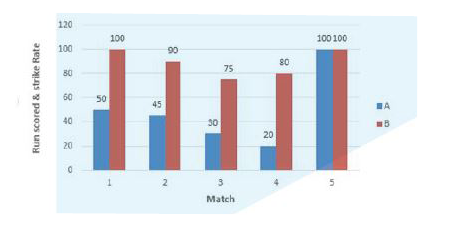
What is the average run scored by the batsman in the five matches?A50B45C49D56.25
The table given below shows the runs scored by 5 players in four matches.
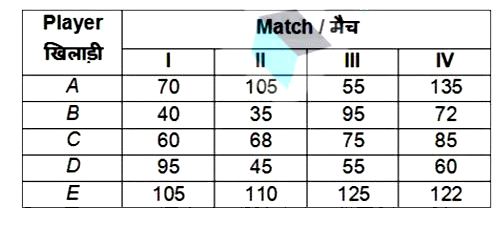
What is the correct order of averages of the given players in the 4 matches?
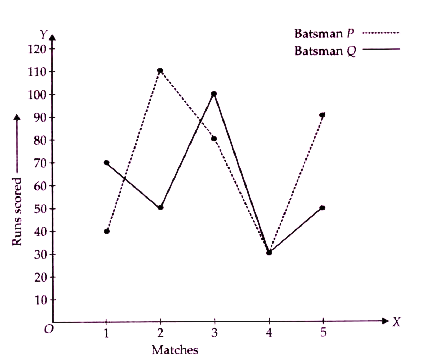
View SolutionPerformance based graph) The given graph shows the total runs scored by two batmans P and Q during each of the five different matches in the year 2011. study the graph and answer the following questions :
Were the run scored by them same in any match in 2011? if so, in which match? .
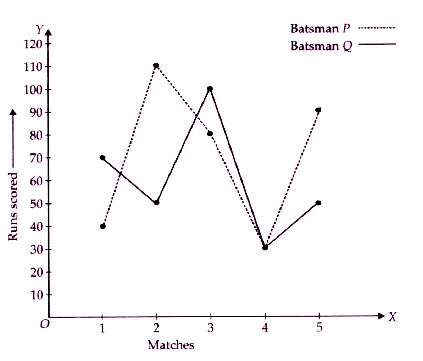
View SolutionPerformance based graph) The given graph shows the total runs scored by two batmans P and Q during each of the five different matches in the year 2011. study the graph and answer the following questions :
Which line shows the runs scored by batmans Q?
View SolutionThe given pie-chart shows the runs scored by 5 players in a match.
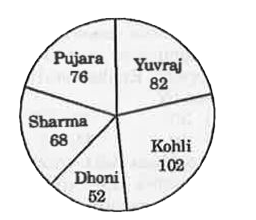
What is the central angle of the (in degree) made by the sector of runs scored by Yuvraj?
View SolutionThe given pie chart shows the runs scored by 5 players in a match.
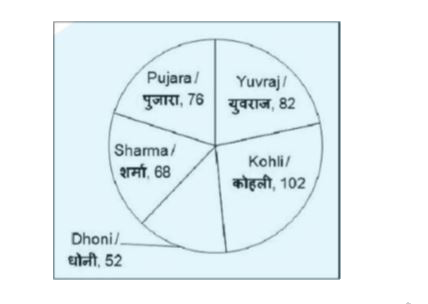
What is the central angle ( in degress) made by the sector of runs scored by Yuvraj ?
View Solution
