Performance based graph) The given graph shows the total runs scored by two batmans P and Q during each of the five different matches in the year 2011. study the graph and answer the following questions :
Were the run scored by them same in any match in 2011? if so, in which match? .
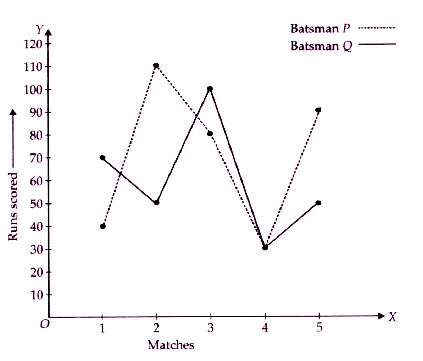
Step by step video & image solution for Performance based graph) The given graph shows the total runs scored by two batmans P and Q during each of the five different matches in the year 2011. study the graph and answer the following questions : Were the run scored by them same in any match in 2011? if so, in which match? . by Maths experts to help you in doubts & scoring excellent marks in Class 8 exams.
Updated on:21/07/2023Topper's Solved these Questions
- INTRODUCTION TO GRAPHS BOOK - MTG IIT JEE FOUNDATIONCHAPTER - INTRODUCTION TO GRAPHS EXERCISE - SOLVED EXAMPLES
25 Videos
- INTRODUCTION TO GRAPHS BOOK - MTG IIT JEE FOUNDATIONCHAPTER - INTRODUCTION TO GRAPHS EXERCISE - NCERT SECTIONS (15.1)
7 Videos
- FOOTSTEPS TOWARDS JEE MAINBOOK - MTG IIT JEE FOUNDATIONCHAPTER - FOOTSTEPS TOWARDS JEE MAINEXERCISE - Section B (Numerical Value Type Questions)
9 Videos
- LINEAR EQUATIONS IN ONE VARIABLEBOOK - MTG IIT JEE FOUNDATIONCHAPTER - LINEAR EQUATIONS IN ONE VARIABLEEXERCISE - Olympiad/HOTS Corner
15 Videos
Similar Questions
Performance based graph) The given graph shows the total runs scored by two batmans P and Q during each of the five different matches in the year 2011. study the graph and answer the following questions :
Which line shows the runs scored by batmans Q?
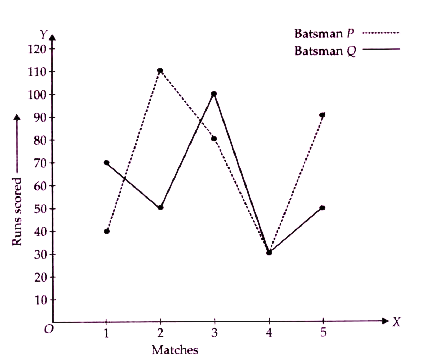
View SolutionPerformance based graph) The given graph shows the total runs scored by two batmans P and Q during each of the five different matches in the year 2011. study the graph and answer the following questions :
What information is given on the axes?
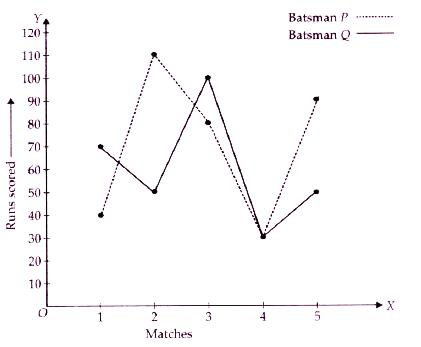
View Solution
Knowledge Check
Study the graph carefully and answer the following questions.
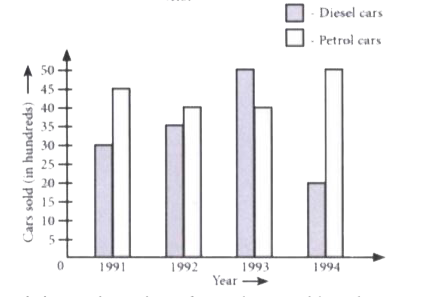
How many cars were sold during the year 1991?A9000B6500C7500D7000The bar graph shows average marks scored in a 100 mark Science exam by students of 7 divisions of Standard X. Study the diagram and answer the following questions.
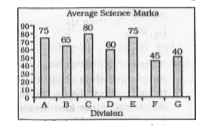
Marks of division F were lesser than that of Division C byAFBBCGDDThe line graph shows the number of deaths due to road accidents in a certain state. Study the diagram and answer the following questions.
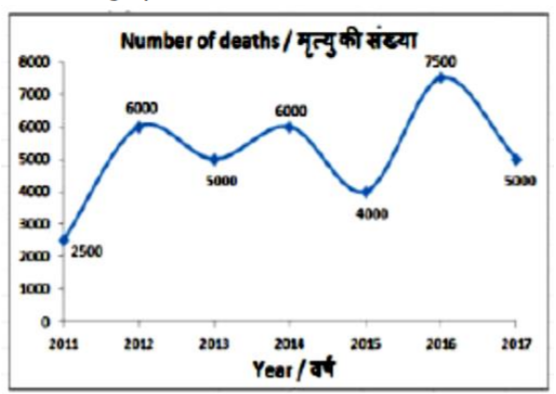
What was the difference in the number of deaths between the years 2011 and 2013?A3500B2000C2500D3000
(A graph on “performance”)The given graph (Fig 15.7) represents the total runs scored by two batsmen A and B, during each of the ten different matches in the year 2007. Study the graph and answer the following questions.(i) What information is given on the two axes?(ii) Which line shows the runs scored by batsman A?(iii) Were the run scored by them same in any match in 2007? If so, in which match?(iv) Among the two batsmen, who is steadier? How do you judge it?
View SolutionThe line graph shows the exprots by a certain company. Study the diagram and answer the following questions.
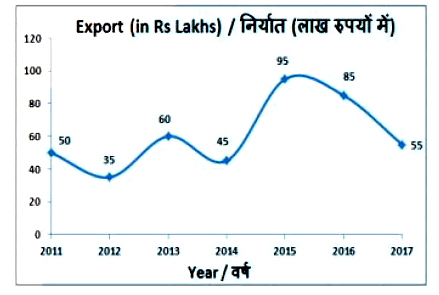
The exports in 2014 were lesser than that in 2011 by ________.
View SolutionThe line graph shows the number of students of a certain university who failed in the given year in their final exams. Study the diagram and answer the following questions
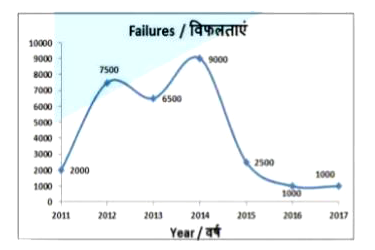
What was the difference in failures between the years 2011 and 2013?
View SolutionThe bar graph shows average marks scored in a 100 marks Science exam by student of 7 divisions of Standard X. Study the diagram and answer the following questions.
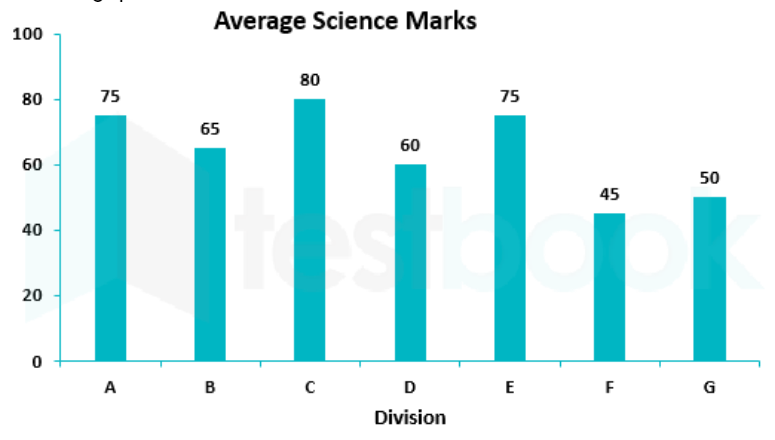
Which division scored the second lowest marks?
View SolutionThe bar graph shows average marks scored in a 100 marks History exam by students of 7 divisions of Standard x. Study the diagram and answer the following questions.
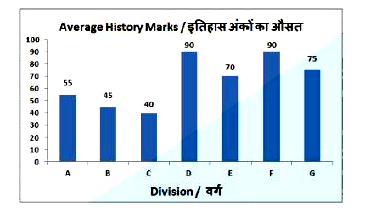
Which division scored the second lowest marks ?
View Solution
