The data given below shows the number of people who have saved a certain amount of money
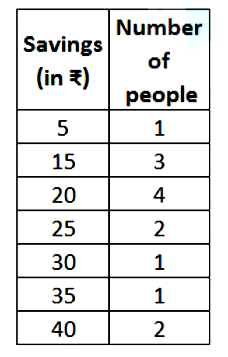
What is the mean saving per person?
Rs 28.89
Rs 21.57
Rs 23.21
Rs 25.54
The correct Answer is:C
Step by step video & image solution for The data given below shows the number of people who have saved a certain amount of money What is the mean saving per person? by Maths experts to help you in doubts & scoring excellent marks in Class 14 exams.
Updated on:21/07/2023Similar Questions
Direction: The following line graph shows the number of Peoples who are working in certain institute and speaks four different language. Study the following data and answer the following questions:
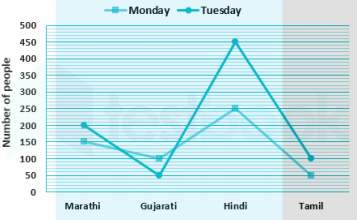
The ratio of the number of people who speaks Marathi language and the number of people who speaks Tamil language on both days - 3 :
View SolutionThe table given below shows number of literate people and total population in a village from the year 2011 to 2016.

What is the percentage of people who are literate in 2012?
View Solution
Knowledge Check
The data below shows the number of students in class A having secured different marks.
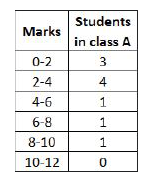
What is the mean marks of class A?A2B3.8C2.8D1.6The Venn diagram below shows the number of people who attended seminars on Physics , Chemistry . Maths and Biology . What is the number of people who attended exactly any two seminars ?
 A21B36C38D42
The pie chart given below shows the expenses incurred and saving by a family in a month. What is the percentage of expenses incurred on account of recreation ?
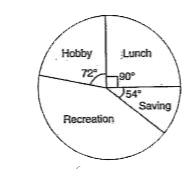 A80017%B20%C35%D40%
The data below shows the number of students in class A and B having secured different marks.
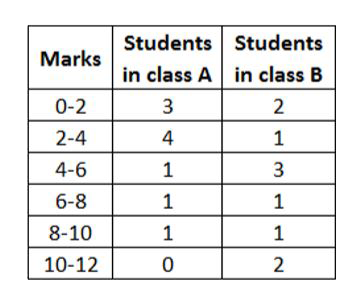
What is the combined mean of A and B?
View SolutionThe table given below shows number of literate people and total population in a village from the year 2011 to 2016.

What is the percentage of people who are literate in 2012?
View SolutionThe data given below shows number of sixes and the number of batsmen who have hit them.
Number of sixesNumber of batsmen1223314352
What is the median of number of sixes ?
View SolutionThe pie chart given below shows the expenditure (in percentage) of Mahesh. The monthly income of Mahesh is Rs. 26000.
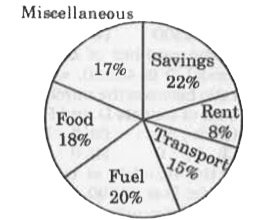
What will be the approximate difference (in Rs.) between the average expenditure on Savings, Rent and Fuel and average expenditure on Food. Transport and Savings?
View SolutionThe bar graph given below shows the spending of a family income on various items and savings during 1993. Observe the graph and answer the following questions :
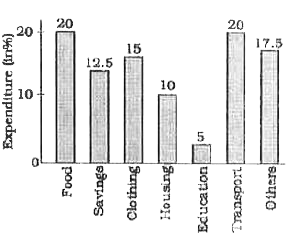
The percent of income spent on clothing exceeds that on savings by :
View Solution
