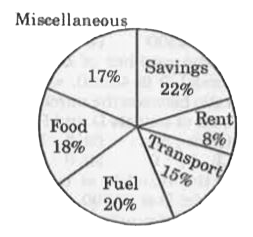
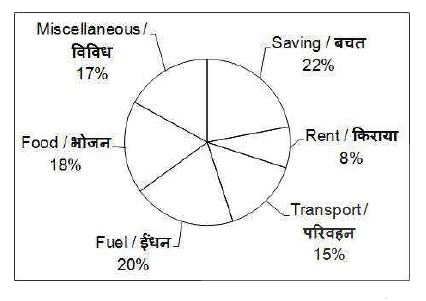
The pie chart given below shows the expenditure (in percentage) of Mahesh. The monthly income of Mahesh is Rs. 26000.
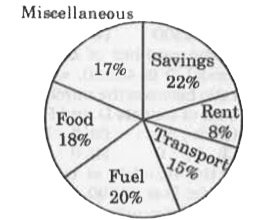
What will be the approximate difference (in Rs.) between the average expenditure on Savings, Rent and Fuel and average expenditure on Food. Transport and Savings?
433
444
417
467
The correct Answer is:A
Step by step video, text & image solution for The pie chart given below shows the expenditure (in percentage) of Mahesh. The monthly income of Mahesh is Rs. 26000. What will be the approximate difference (in Rs.) between the average expenditure on Savings, Rent and Fuel and average expenditure on Food. Transport and Savings? by Maths experts to help you in doubts & scoring excellent marks in Class 14 exams.
Topper's Solved these Questions
- BOOK - KIRAN PUBLICATIONCHAPTER - STATISTICS AND DATA INTERPRETATIONEXERCISE - TYPE-VIII8videos
STATISTICS AND DATA INTERPRETATION
- BOOK - KIRAN PUBLICATIONCHAPTER - STATISTICS AND DATA INTERPRETATIONEXERCISE - TYPE-VI86videos
STATISTICS AND DATA INTERPRETATION
- BOOK - KIRAN PUBLICATIONCHAPTER - SIMPLIFICATIONEXERCISE - TEST YOURSELF25videos
SIMPLIFICATION
- BOOK - KIRAN PUBLICATIONCHAPTER - TIME AND DISTANCEEXERCISE - Type -XI74videos
TIME AND DISTANCE
Similar Questions
Knowledge Check
- Question 1 - Select One
The pie chart given below shows the expenditure (in percentage) of Mahesh. The monthly income of Mahesh is Rs. 26000.
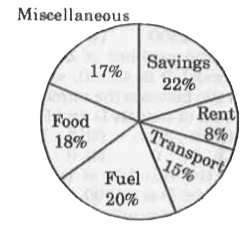
How much does he spend (in Rs.) on Rent?A2080B2275C2470D2840 - Question 2 - Select One
The pie chart given below shows the expenditure (in percentage) of Mahesh. The monthly income of Mahesh is Rs 26000.
How much does he spend (in Rs) on Rent?A2080B2275C2470D2840 - Question 3 - Select One
The pie chart given below shows the expenditure (in percentage) of Mahesh. The monthly income of Mahesh is Rs. 26000.
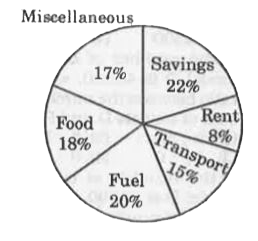
How much does he spend (in Rs.) of the Saving and Fuel taken together than that on Transport?A5850B6060C7020D8420
The pie chart given below shows the expenditure (in percentage) of Mahesh. The monthly income of Mahesh is Rs. 26000.
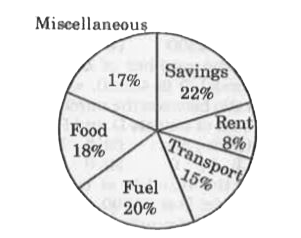
The invests 65% of his savings on purchasing gold, then how much amount (in Rs.) does he spend on gold?View SolutionThe pie chart given below shows the monthly expenses on various heads of a family . The total expenditure of the family is Rs 30000.
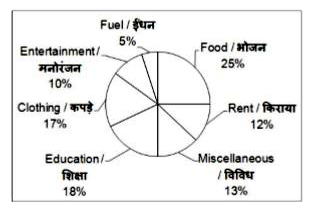
What is the amount (in Rs) spent on food ?View SolutionThe given pie-chart shows the breakup (in percentage) of monthly expenditure of a person.
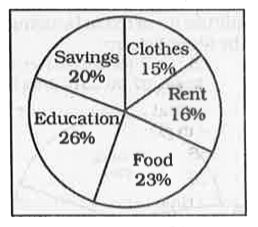
If the total salary of the person is Rs. 50000, what will be the expenditure (in Rs.) on Rent?View SolutionThe given pie chart shows the distribution of expenditure of a company (in percentage) . The total expenditure of the company is Rs. 136000.
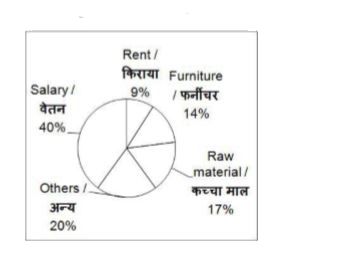
What is the difference (in degrees) in the central angles formed by the total expenditure incurred on Furniture and Rent and expenditure incurred on Others?View SolutionThe given pie chart shows the distribution of expenditure of a company (in percentage) . The total expenditure of the company is Rs. 136000.
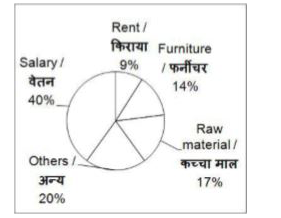
What will be the ratio of the expenditure incurred on Salary to the expenditure incurred on Rent?View Solution

