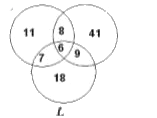
The above Venn diagram represent the students who play 3 sports M, N and L in a class. Total number of students who play game M is :
7
11
32
21
The correct Answer is:C
Step by step video, text & image solution for The above Venn diagram represent the students who play 3 sports M, N and L in a class. Total number of students who play game M is : by Reasoning experts to help you in doubts & scoring excellent marks in Class 14 exams.
Updated on:21/07/2023Similar Questions
Knowledge Check
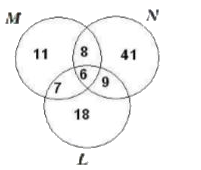
The above venn diagram represent the students who play 3 sport M,N and L in a class:
Total number of students who play game N is:A41B64C23D9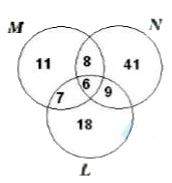
The above Venn diagram represent the students who play 3 sports M, N and L in a class
Total number of students who play N & L but not M game is: Options are (a) 15 (b) 68 (c) 9 (d) 12.A15B68C9D12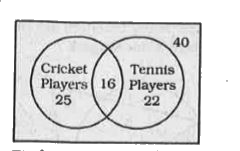
Find out the number of students who play only cricket.A25B18C9D41
The pie chart given below shows the number of students who play five sports like Hockey, Tennis Cricket, Golf and Polo. The total number of students is 1080.
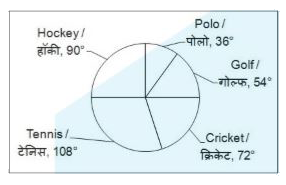
What is the average number of students playing Tennis and Cricket?
View SolutionThe pie chart given below shows the number of students who play five sports like Hockey, Tennis Cricket, Golf and Polo. The total number of students is 1080.
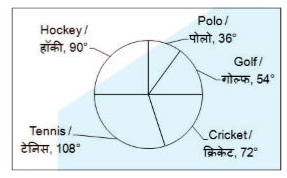
What is the difference between the number of students who play Tennis and those who play Polo?
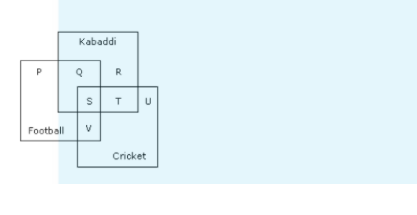
View SolutionThe diagram below represents the students who play cricket, football and kabaddi
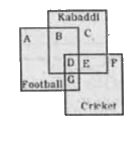
Seeing the diagram indicate the students who play all the 3 games.
View SolutionIn a class of 65 students , 30 students play cricket and 20 students play tennis and 10 students play both the games Then , the number of students who play neither is :
View SolutionThe given Venn diagram represents results of a class students:
The triangle represents students who scored 85% and above in Maths, the circle represents students who scored 85% and above in English, the rectangle represents students who scored 85% and above in Science, and the square represents students who scored 85% and above in Social Science. The numbers given in the diagram represent the number of students in that particular category.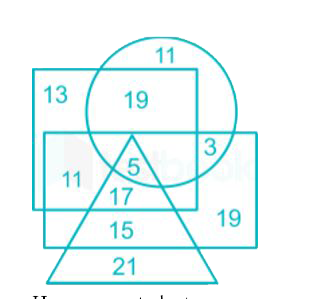
How many students scored 85% and above in all the subjects?
View Solution

