The given Venn diagram represents results of a class students:
The triangle represents students who scored 85% and above in Maths, the circle represents students who scored 85% and above in English, the rectangle represents students who scored 85% and above in Science, and the square represents students who scored 85% and above in Social Science. The numbers given in the diagram represent the number of students in that particular category. 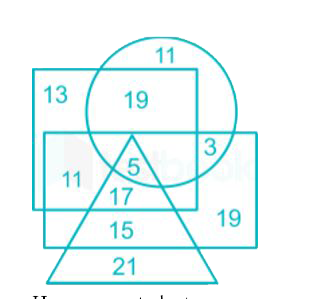
How many students scored 85% and above in all the subjects?
(A) 15
(B) 11
(C) 17
(D) 5
The correct Answer is:D
Step by step video, text & image solution for The given Venn diagram represents results of a class students: The triangle represents students who scored 85% and above in Maths, the circle represents students who scored 85% and above in English, the rectangle represents students who scored 85% and above in Science, and the square represents students who scored 85% and above in Social Science. The numbers given in the diagram represent the number of students in that particular category. How many students scored 85% and above in all the subjects? by Reasoning experts to help you in doubts & scoring excellent marks in Class 14 exams.
Updated on:21/07/2023Similar Questions
The following figures represent students who can play, sing and dance

Which part of the figure represents students who can sing and dance ?
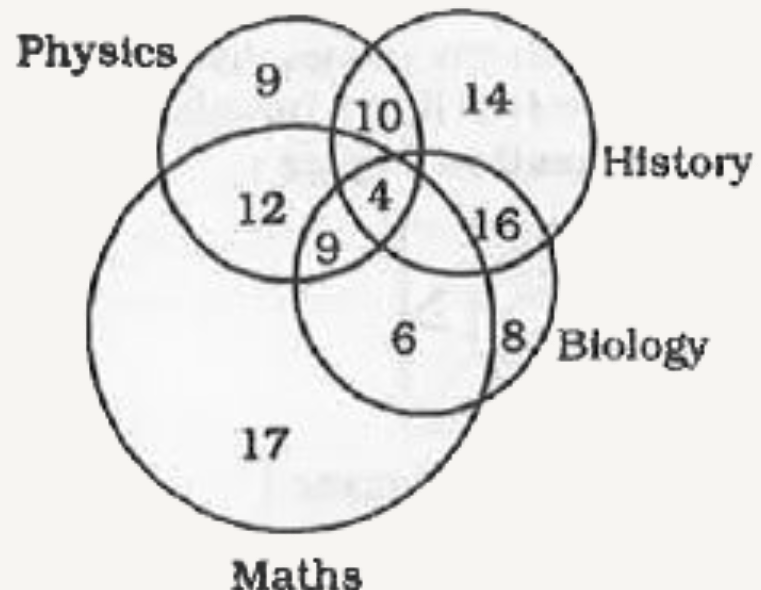
View SolutionThe diagram represents the number of students studying different subjects. What is the number of students who study History and Biology?
View Solution
Knowledge Check
In the given Venn diagram, the triangle represents student playing table tennis, the rectangle represents students playing badminton, the circle represent female students, and the pentagon represents student playing football. The numbers given in the diagram represent the number of persons in that particular category.
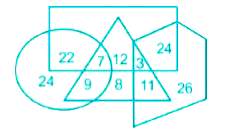
How many female students play both table tennis and badminton?A18B9C22D7In the Venn diagram shown here, the triangle represents students the circle represents diploma holders and the quadrilateral represents graduates. The number given in the diagram represents number of persons of that particular category.
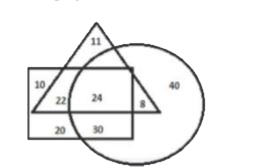
How many students are diploma holders but NOT graduates?A40B11C30D8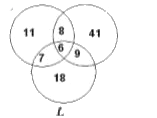
The above Venn diagram represent the students who play 3 sports M, N and L in a class. Total number of students who play game M is :A7B11C32D21
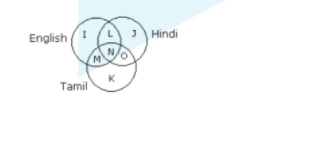
The given Venn diagram represents the students who can speak different languages. According to it, the total number of students who can speak exactly two languages is ______.
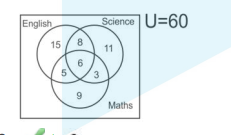
View SolutionThe given Venn diagram shows the number of students who have passed in the three exams, viz, english, science and Maths. How many students failed in all the three exams?
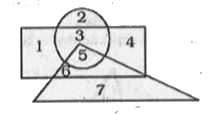
View SolutionIn the following figure, the triangle represents teachers, the circle represents students and the rectangle represents actors. Which number represents teachers who are also students and actors?
View Solution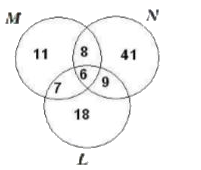
The above venn diagram represent the students who play 3 sport M,N and L in a class:
Total number of students who play game N is:
View SolutionThe diagram represents the students who are singers, dancers and poets :

Study the diagram and identify the region which represents the students who are both poets and singers but not dancers :
View Solution
