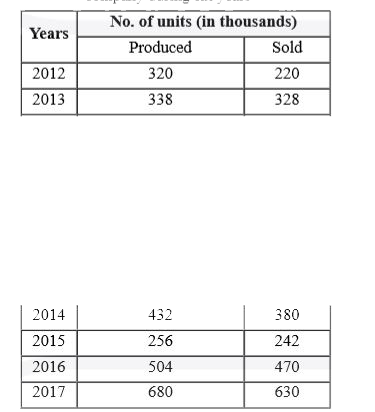
The following table presents the number of units of a product produced and sold by a company during six years.
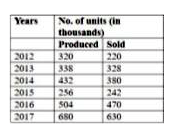
In which year, the production of units of the product is approximately 31.4% less than sale of units in 2017 ?
2012
2014
2016
2013
The correct Answer is:B
Step by step video, text & image solution for The following table presents the number of units of a product produced and sold by a company during six years. In which year, the production of units of the product is approximately 31.4% less than sale of units in 2017 ? by Maths experts to help you in doubts & scoring excellent marks in Class 14 exams.
Updated on:21/07/2023Similar Questions
Study the following table, which shows the number of units of a product manufactured and sold by a company in five years, and answer questions.
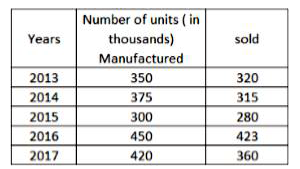
In which year the number of units of the product sold is 19000 more than the average number of units manufactured per year?
View SolutionStudy the following table, which shows the number of units of a product manufactured and sold by a company in five years, and answer questions.
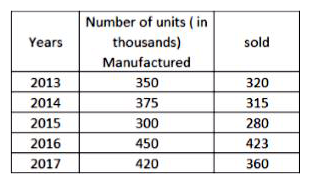
What percent of total units of the product manufactured in 2013 and 2015 is the total units unsold during the five years? (correct to one decimal place)
View Solution
Knowledge Check
The following table presents the number of units of a product produced and sold by a company during six years.
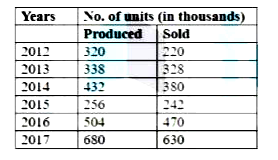
The number of units of the product sold in 2016 is approximately what percent more than the average production of the units in 2012 to 2016 ?A24B32C27D21Directions: The following table presents the number of units of the product produced and sold by a company during six years
Find the ratio between total production and total salesA227 : 253B2530 : 2270C253 : 227D253 : 220The following table presents the number of units of a product produced and sold by a company during six years.
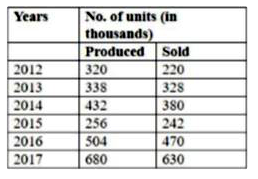
What is the ratio of the total number of units of the product sold in 2013 and 2015 to that prodcued in 2015 and 2016 ?A3:4B7:9C29:38D14:19
Formation of table for the production and sales of a company in different years
View SolutionStudy the following table, (which shows the number of units of an item manufactured and sold by 5 companies) and answer the question
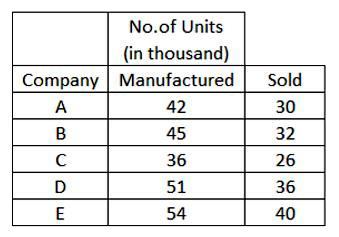
The ratio of the number of units manufactured by companies C and E together and the number of units sold by A and D together is?
View SolutionStudy the following table, (which shows the number of units of an item manufactured and sold by 5 companies) and answer the question.
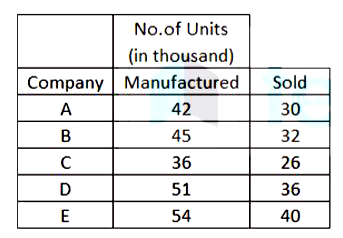
What percent of total number of units sold by companies A, B and D is equal to the number of units manufactured by company C? (correct to one decimal place)
View SolutionStudy the following table, (which shows the number of units of an item manufactured and sold by 5 companies) and answer the question.
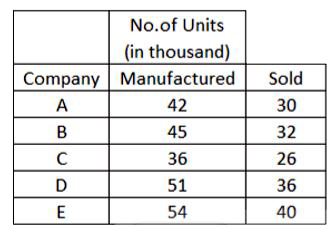
Which Company sold the highest percentage of units as compared to manufactured by it?
View SolutionThe company in which the production of motorcycles is approximately 26% more than the Demand is
View Solution
