Formation of table for the production and sales of a company in different years
Step by step video & image solution for Formation of table for the production and sales of a company in different years by Maths experts to help you in doubts & scoring excellent marks in Class 14 exams.
Updated on:21/07/2023Similar Questions
Knowledge Check
Directions: The following table presents the number of units of the product produced and sold by a company during six years
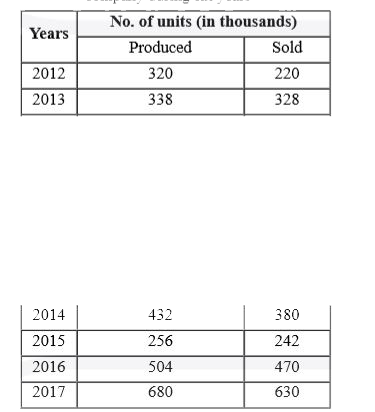
Find the ratio between total production and total salesA227 : 253B2530 : 2270C253 : 227D253 : 220The table given below represents the production and sales of wheat in 4 different countries A, B, C and D over a period of 4 years. At the end of year 2010 A, B, C and D had a stock of 5200, 3500, 7835 and 1956 (in '000 quintals) of wheat respectively. For any given year, the stock of wheat is calculated as :
Stock of year (n + 1) = stock at end of year (n) + production in year (n + 1) - sales in year (n + 1)
And Surplus or year (n) = production in year (n) - sales in year (n)
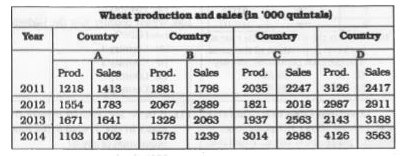
What is the difference between (in '000 quintals) in average production and average sales respectively country C in the given four years?A-252.25B-415.5C350.75D275.25The table given below represents the production and sales of wheat in 4 different countries A, B, C and D over a period of 4 years. At the end of year 2010 A, B, C and D had a stock of 5200, 3500, 7835 and 1956 (in '000 quintals) of wheat respectively. For any given year, the stock of wheat is calculated as :
Stock of year (n + 1) = stock at end of year (n) + production in year (n + 1) - sales in year (n + 1)
And Surplus or year (n) = production in year (n) - sales in year (n)
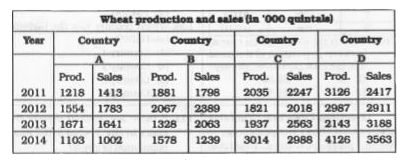
What is the stock (in '000 quintals) of country C at end of the four year period?A5926B6213C6826D8844
Reading of line graphs containing the production and sales of a company in a period
View SolutionRead the following graph carfully and answer the questions given below. Production of bulbs by different companies in three years (In lakhs)
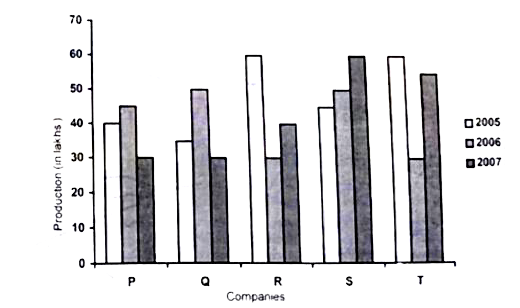
What is the ratio of average production of company Q to the average production of company T in all the given years?
View Solution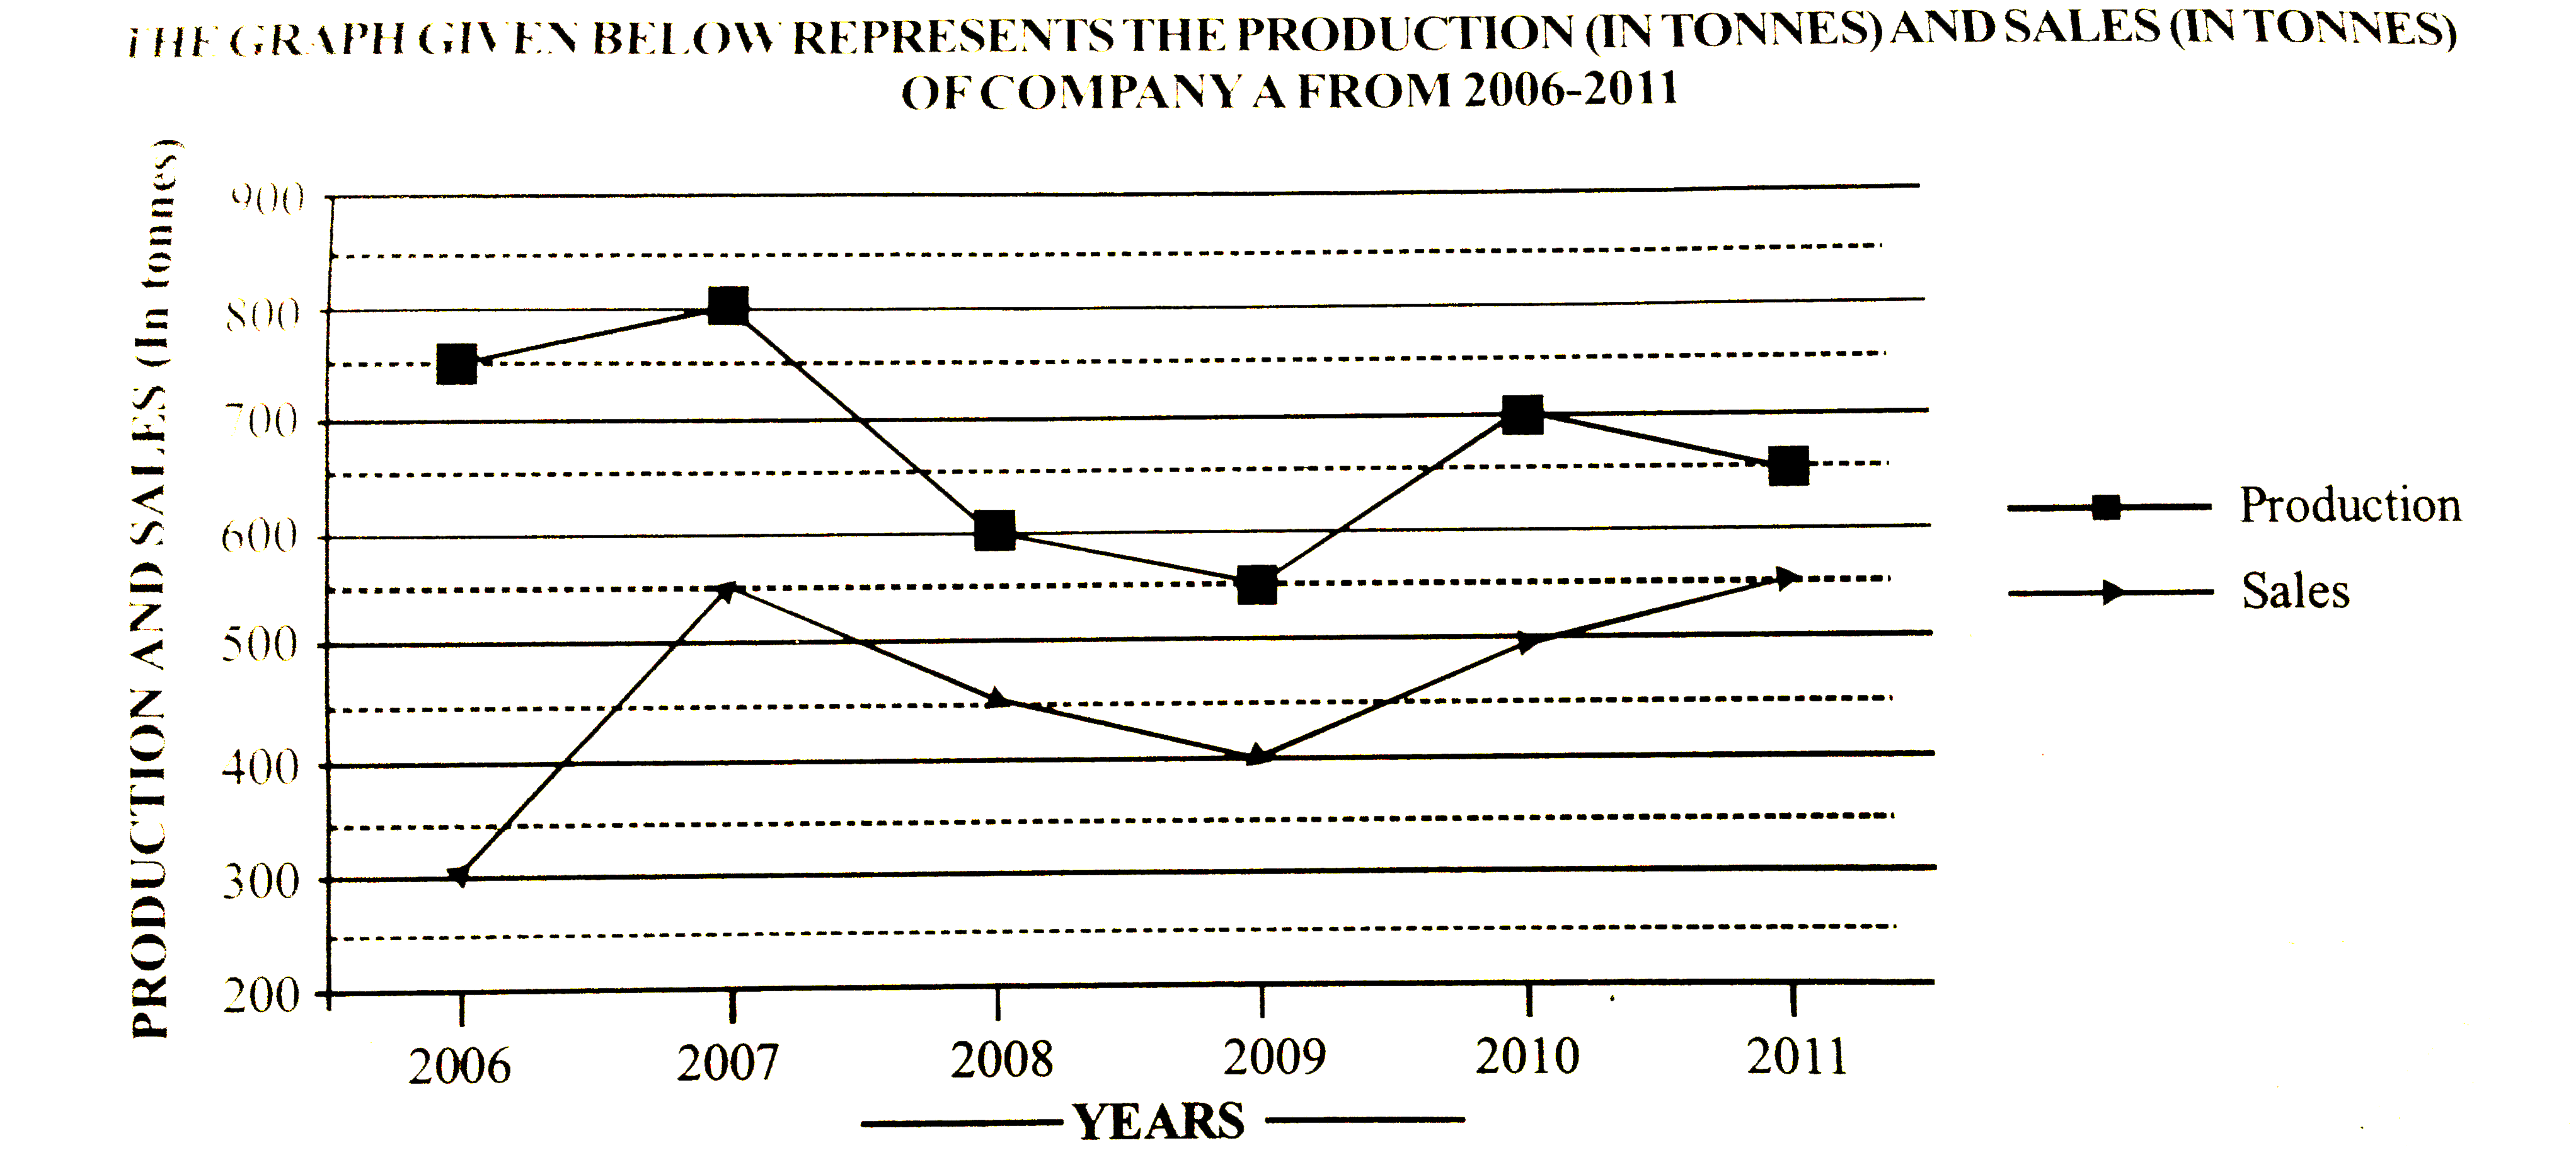
The table given below represents the respective ratio of the production (in tonners) of Company A to the production (in tonnes) of Company B, and the respective ratio of the sales (in tonnes )of Company A to the sales (in tonnes) of Company. B.
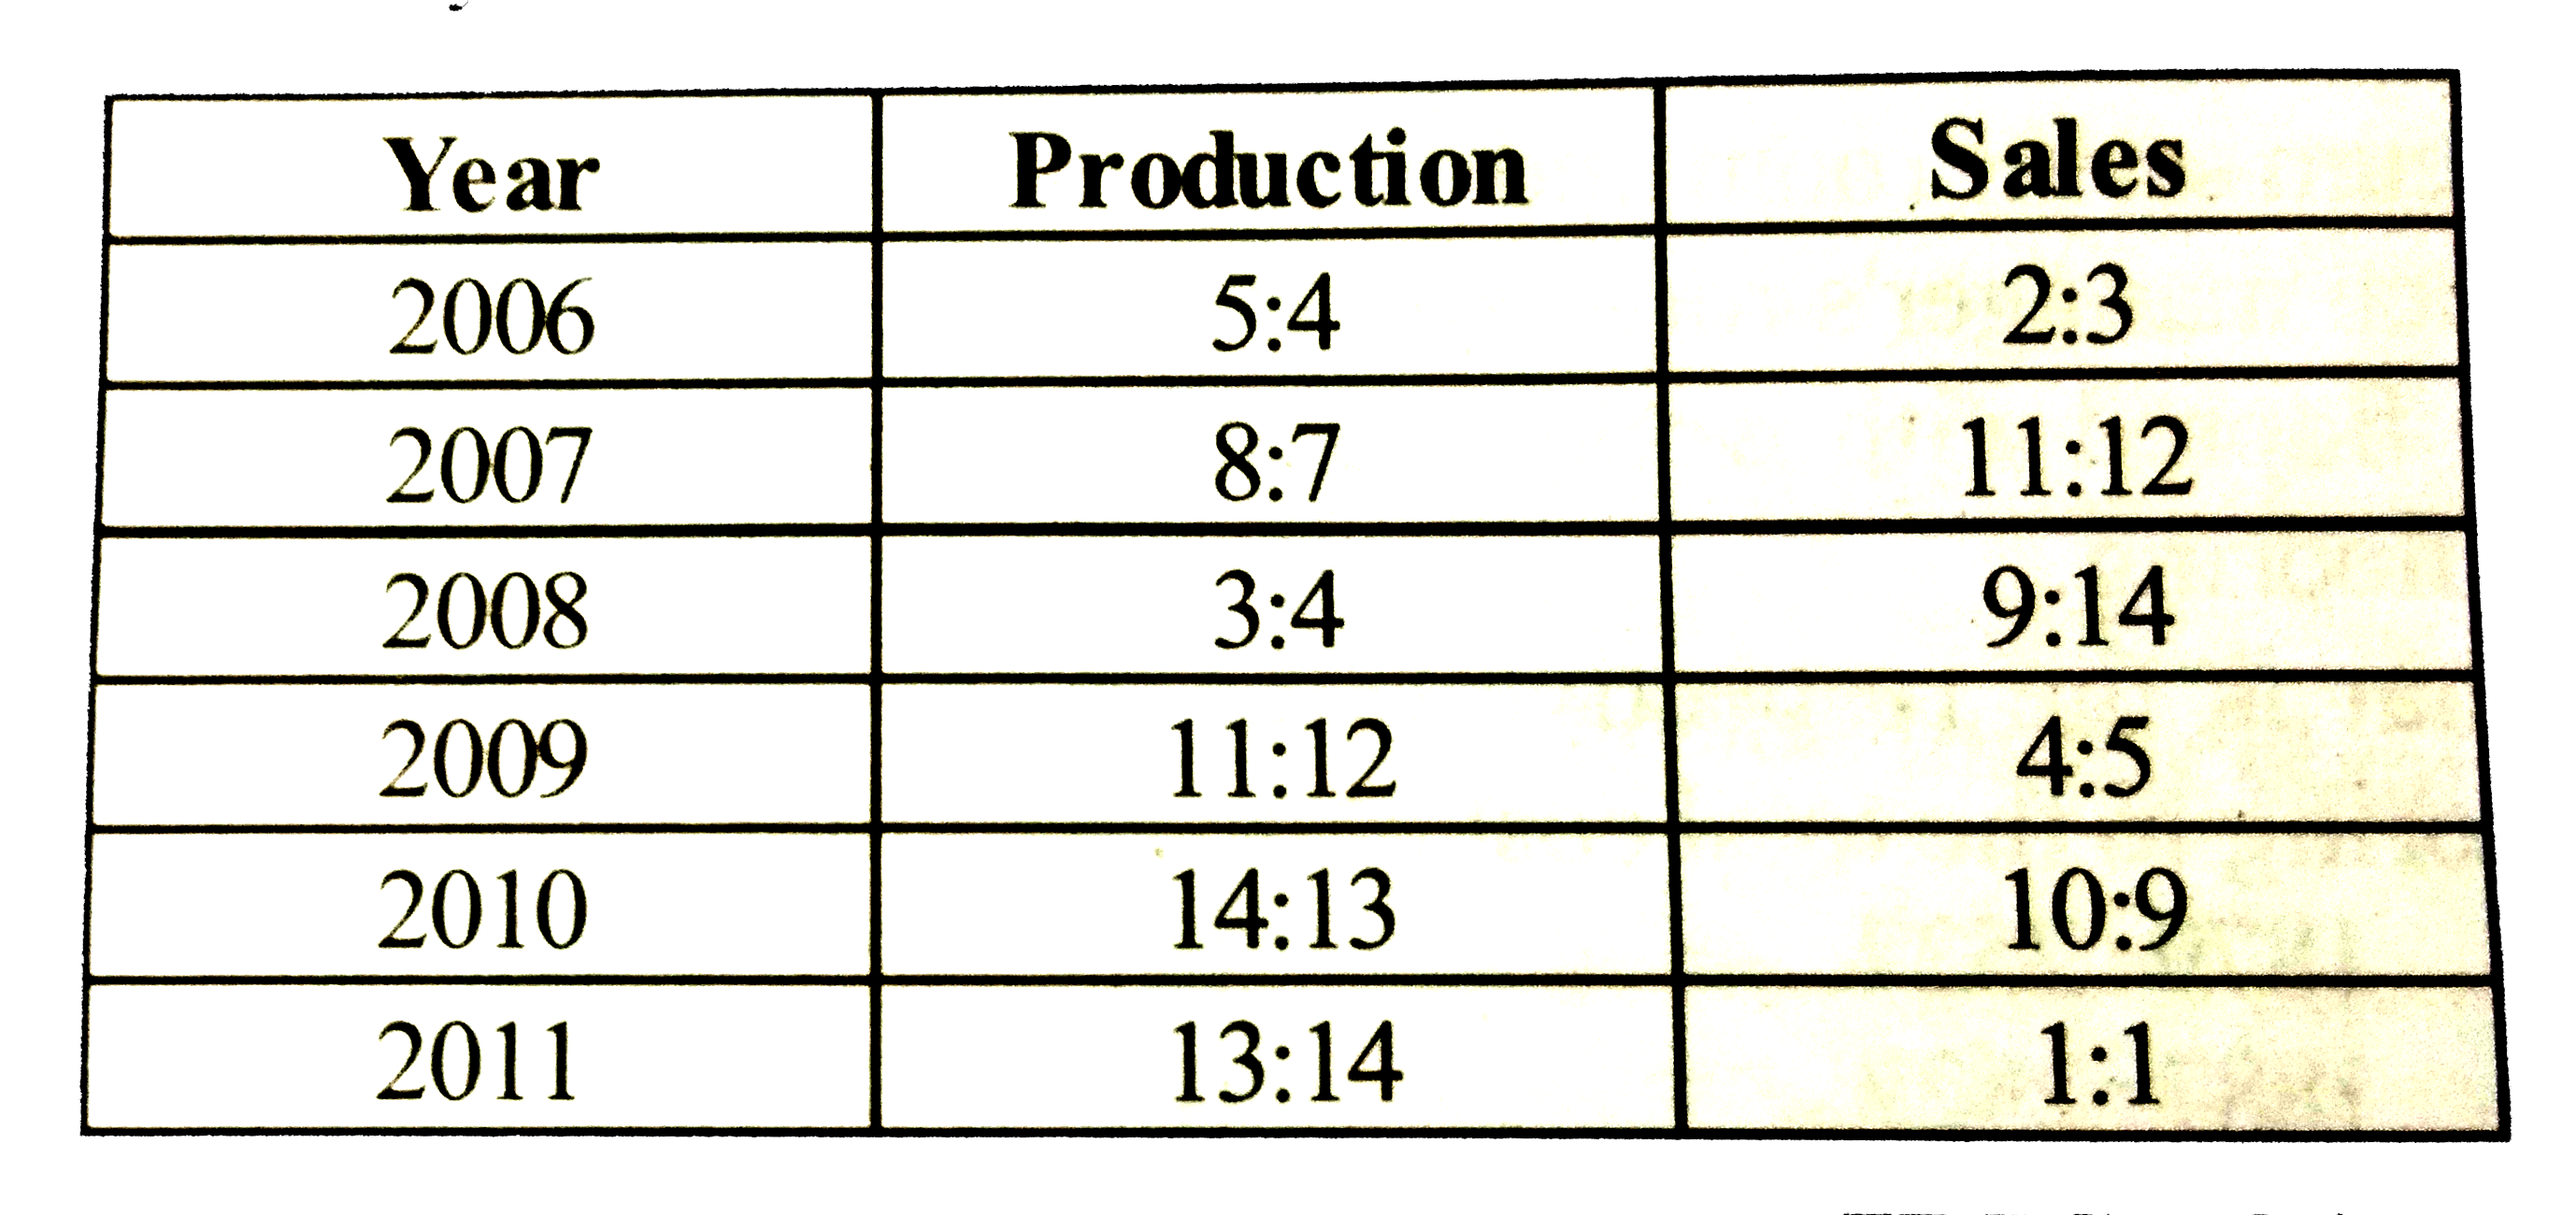
What is the respective ratio of the total production (in tonnes) of Company A to the total sales (in tonnes) of Company A?
View SolutionThe table given below represents the production and sales of wheat in 4 different countries A, B, C and D over a period of 4 years. At the end of year 2010 A, B, C and D had a stock of 5200, 3500, 7835 and 1956 (in '000 quintals) of wheat respectively. For any given year, the stock of wheat is calculated as :
Stock of year (n + 1) = stock at end of year (n) + production in year (n + 1) - sales in year (n + 1)
And Surplus or year (n) = production in year (n) - sales in year (n)
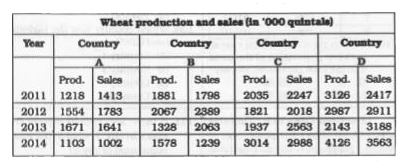
What can be said about total surplus of country B and country D over the 4 years?
View SolutionThe table given below represents the production and sales of wheat in 4 different countries A, B, C and D over a period of 4 years. At the end of year 2010 A, B, C and D had a stock of 5200, 3500, 7835 and 1956 (in '000 quintals) of wheat respectively. For any given year, the stock of wheat is calculated as :
Stock of year (n + 1) = stock at end of year (n) + production in year (n + 1) - sales in year (n + 1)
And Surplus or year (n) = production in year (n) - sales in year (n)
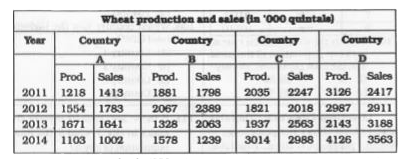
What is the surplus (in '000 quintals) of country A of years 2013 and 2014 taken together?
View Solution
