Interpret the given graph. Also find the acceleration.
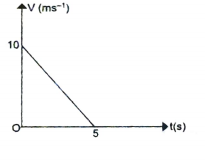 Solution in Punjabi
Step by step video & image solution for Interpret the given graph. Also find the acceleration. by Physics experts to help you in doubts & scoring excellent marks in Class 9 exams.
Updated on:21/07/2023Topper's Solved these Questions
Similar Questions
Let a car stawrt from I (initial position) and move in a semi-circular path in clockwise direction and reach f (Final position) which is diametrically opposite to i. Distance = πr Displacement = 2r
View SolutionA particle is thrown up vertically with a velocity of 50 m/s. What will be its velocity at the highest point of its journey?
View SolutionIn which of the three media, air, water or iron sound travel the fastest at a particular temperature ?
View SolutionInterpretation of BAR Graphs
View SolutionEvaluate [ijk]. Also, interpret it geometrically.
View SolutionReading and interpretation of bar graphs
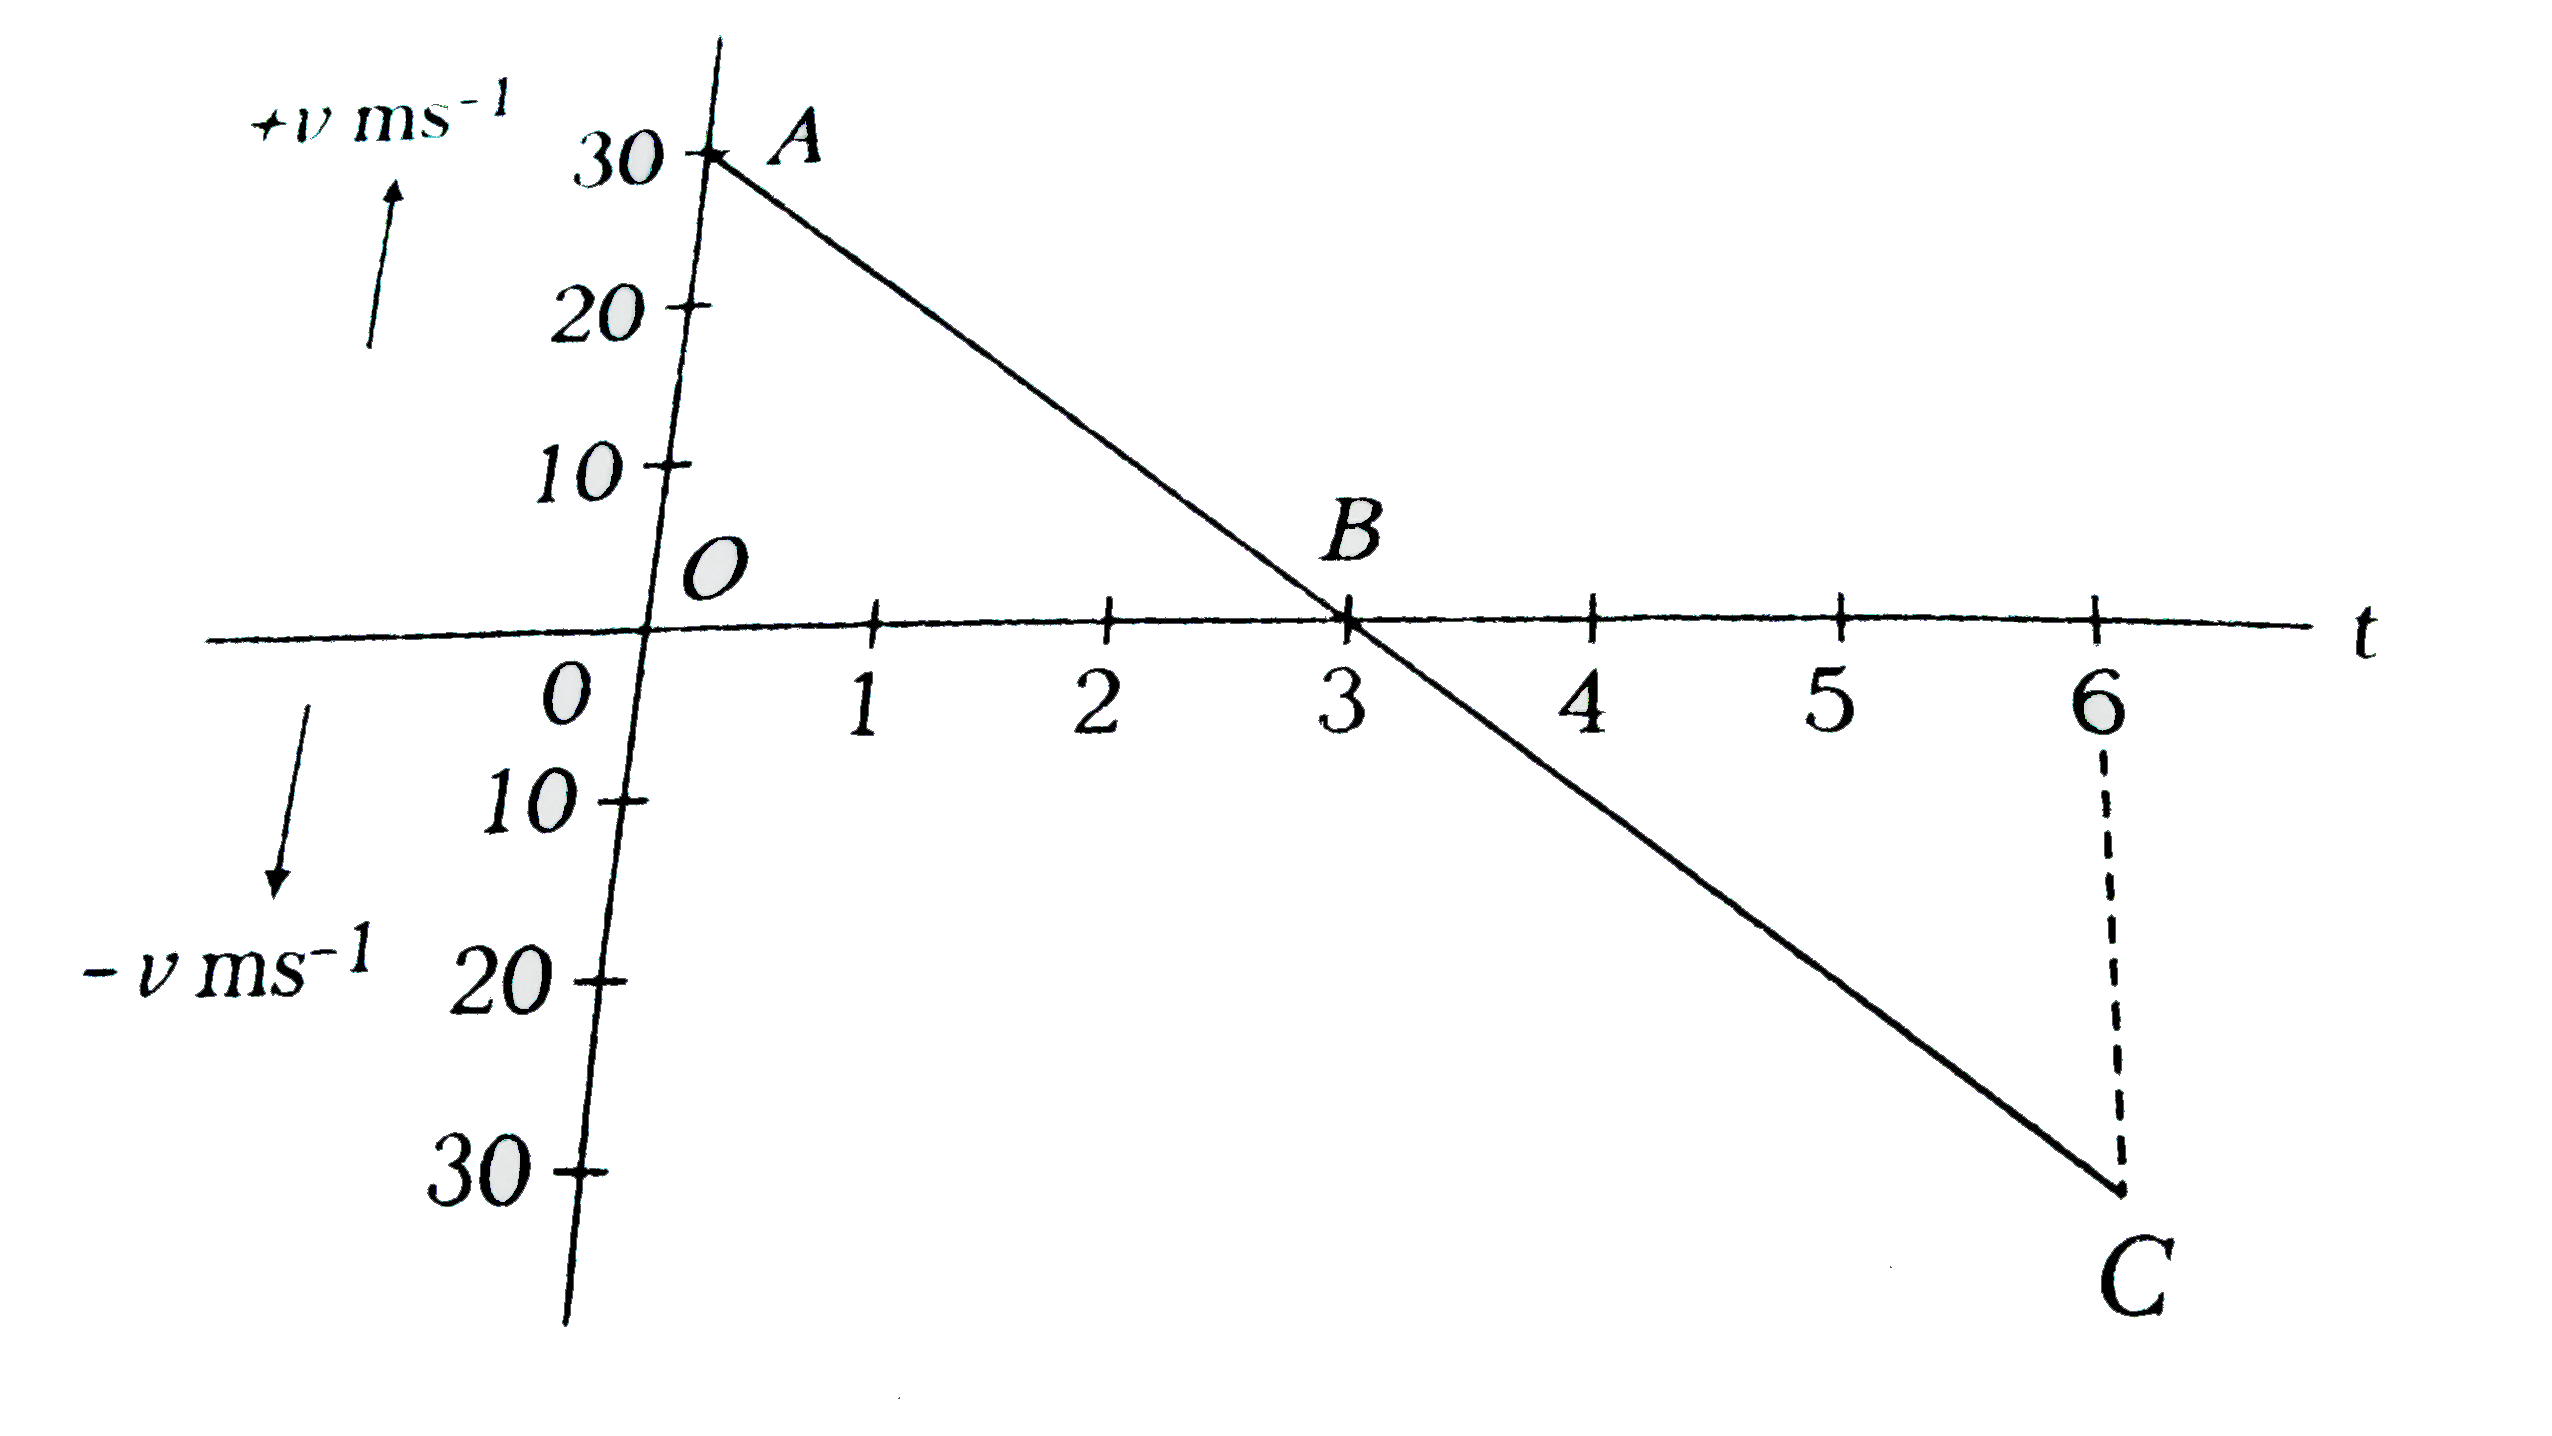
View SolutionWith the help of the given velocity - time graph, find the
(i) displacement in first three seconds and
(ii) acceleration for the graph.
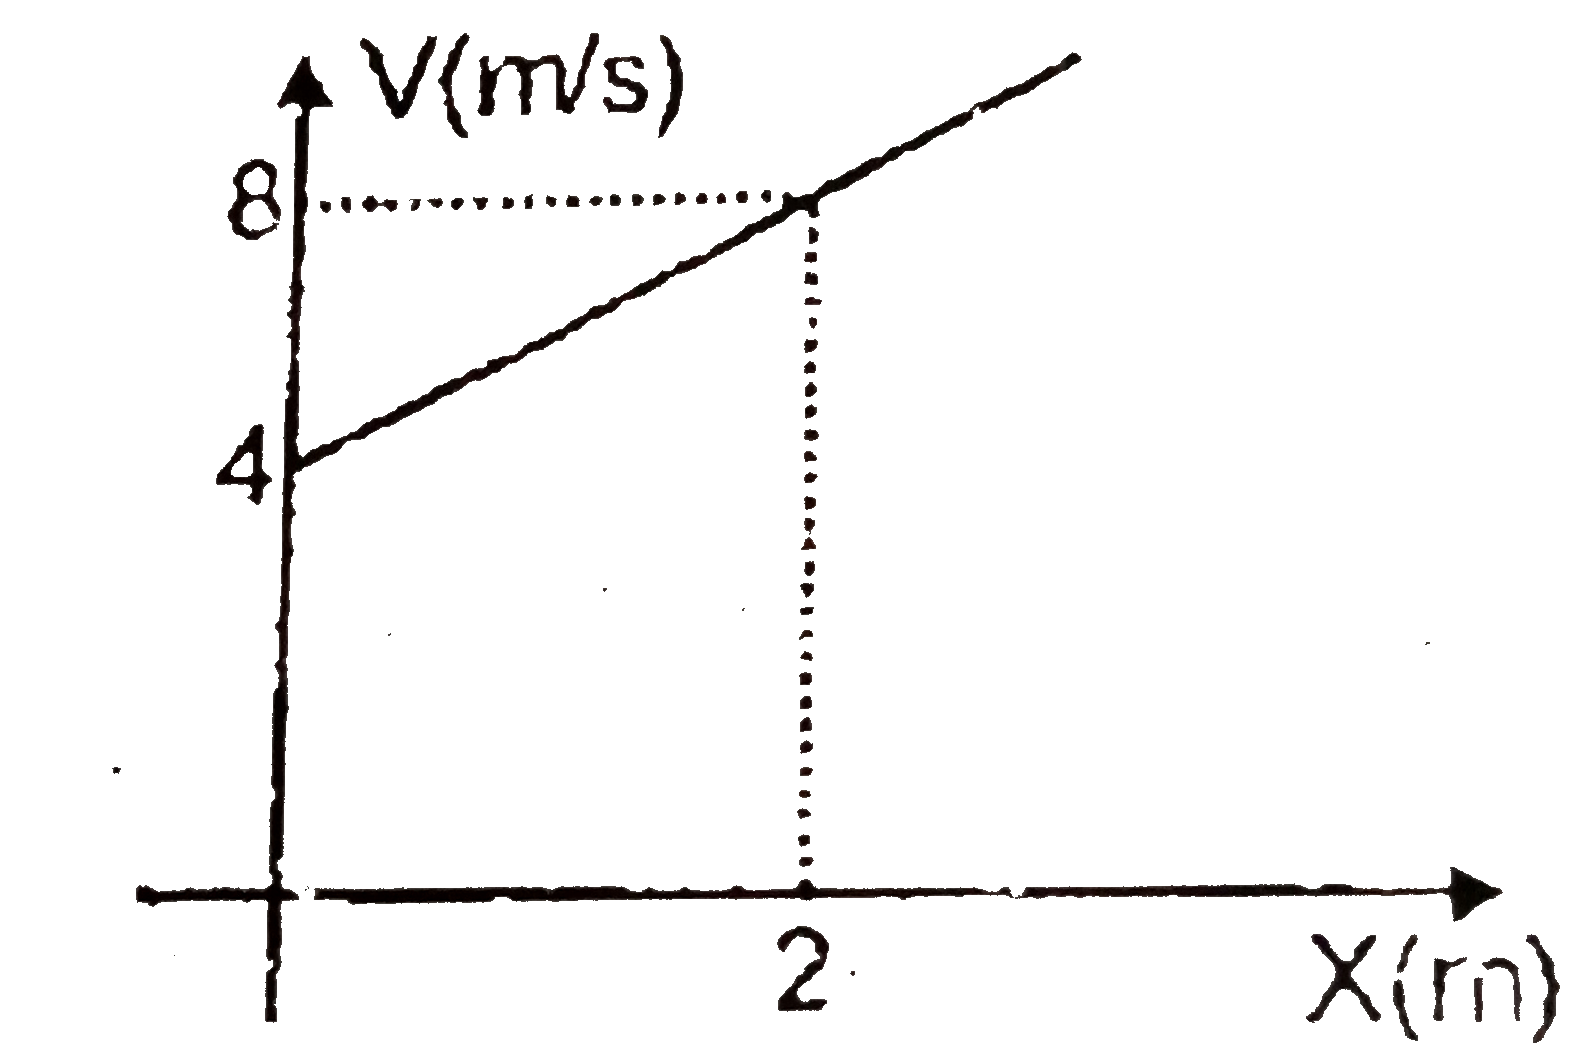
View SolutionIn the given velocity v/s position graph find acceleration at x = 2m
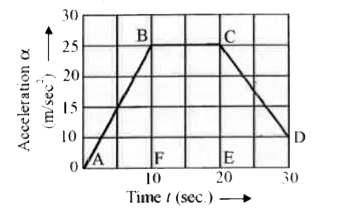
View Solutionदिये गये चित्र में एक सीधी रेखा में गति करने वाली वस्तु का समय त्वरण ग्राफ दिया गया है| ग्राफ से ज्ञात कीजिये
(i ) प्रथम 20 सेकण्ड से औसत त्वरण
(ii ) वस्तु पर किस समय से किस समय तक बल अचर रहा ?
View SolutionExplain the geometrical interpretation of simple harmonic motion. Also find the maximum and minimum values of velocity and acceleration for a particle executing simple harmonic motion.
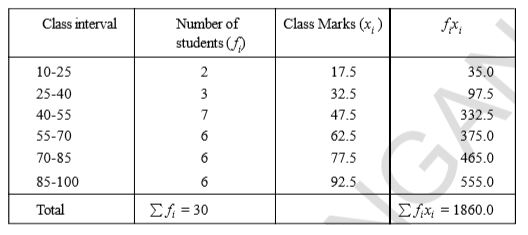
View SolutionThe marks distribution of 30 students in a mathematics examination are given in the adjacent table. Find the mode of this data. Also compare and interpret the mode and the mean .
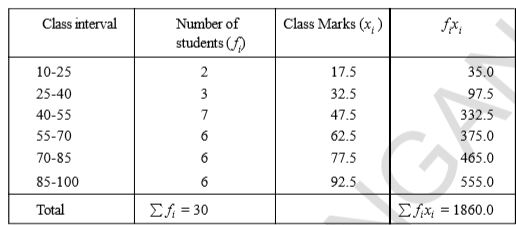
View SolutionThe marks distribution of 30 students in a mathematics examination are given in the adjacent table. Find the mode of this data. Also compare and interpret the mode and the mean .
View SolutionExplain the reading and interpretation of bar graphs.
View SolutionExplain the graphical interpretation of position time graph.
View SolutionVelocity-displacement graph is given in figure below. Then draw acceleration-displacement graph
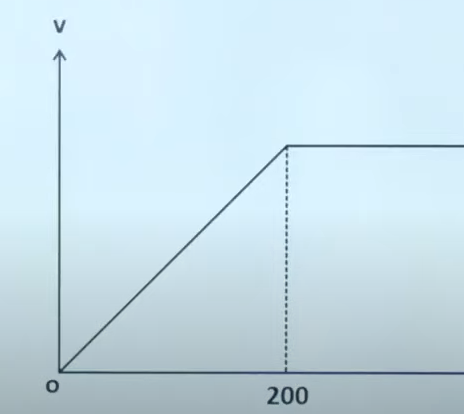
View Solution
