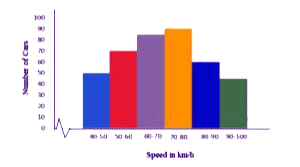
The given histogram shows the frequency distribution of the speed of cars passing though at a particular spot on a highway. Study the graph and answer the question that follows.
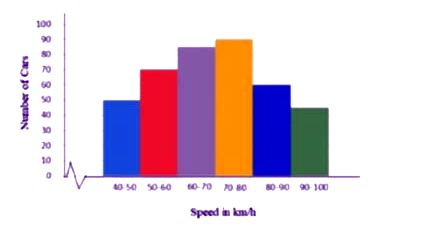
What percentage of cars were running with speed less than 70 km/h?
30%
51.25%
60%
45.75%
The correct Answer is:B
Step by step video, text & image solution for The given histogram shows the frequency distribution of the speed of cars passing though at a particular spot on a highway. Study the graph and answer the question that follows. What percentage of cars were running with speed less than 70 km/h? by Maths experts to help you in doubts & scoring excellent marks in Class 14 exams.
Updated on:21/07/2023Similar Questions
In the given histogram what percentage of cars were running with the speed less than 60km/h
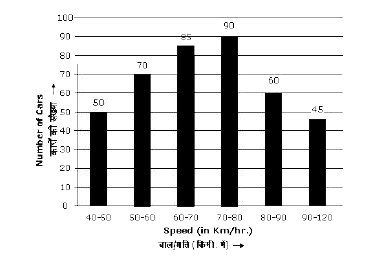
View SolutionFollowing table shows a frequency distribution for the speed of cars passing through at a particular spot on a high way.

Draw a histogram and frequency polygon representing the data above.
View Solution
Knowledge Check
The given histogram shows the frequency distribution of the speed of cars passing though at a particular spot on a highway. Study the graph and answer the question that follows.
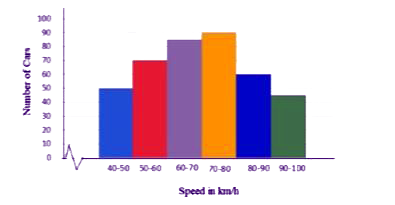
What is the ratio of the number of cars with speed less than 60 km/h to the number of cars with speed more than 80 km/h?A7:8B8:7C4:5D5:4The given histogram shows the frequency distribution of the speed of cars passing through a particular spot on a highway. Read the graph and answer the following question.
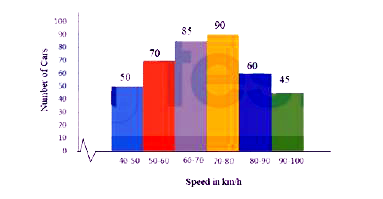
What percentage of cars were running with the speed of 90 km/h and above?A10%B21.25%C11.25%D15.75%The given histogram shows the frequency distribution of the speed of cars passing though at a particular spot on a highway. Study the graph and answer the question that follows
The number of cars with speed between 70km/h and 80km/h is what percentage more than the number of the cars with speed between 50 km/h and 60 kmh ? (correct to one decimal place)A29.7%B15.5%C22.2%D28.6%
Study the following graph and answer the question based on the graph.
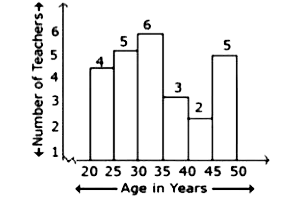
What percentage of the total number of teachers are aged less than 45 years?
View SolutionThe given graph represents the percentage distribution of the total expenditure of a company. Study the graph and answer the question that follows,
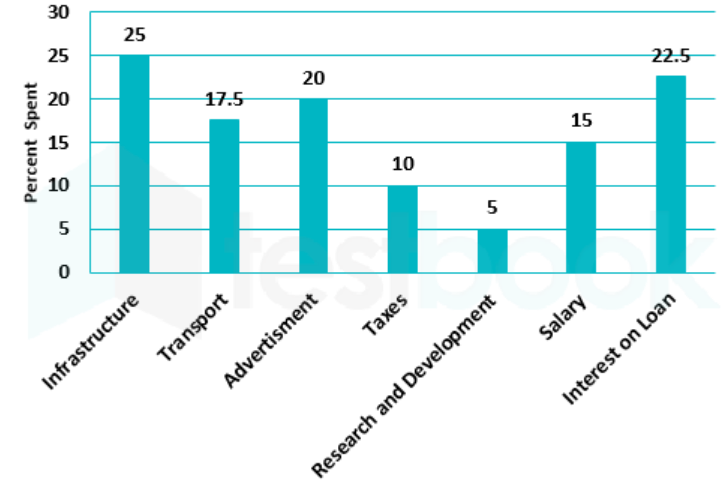
The expenditure on 'Interest on loans' is what percentage more than the expenditure on 'Transpott' ?
View SolutionThe given histogram shows the frequency distribution of the speed of cars passing through a particular spot on a highway. Read the graph and answer the following question.
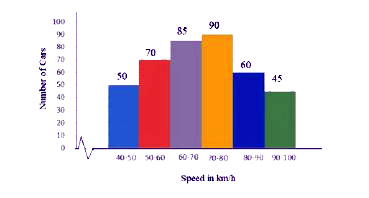
What is the ratio of the number of cars with speed less than 60 km h to the number of cars with speed more than 70 km/h?
View SolutionThe given histogram shows the frequency distribution of the speed of cars passing through a particular spot on a lighway. Read the graph and answer the following question.
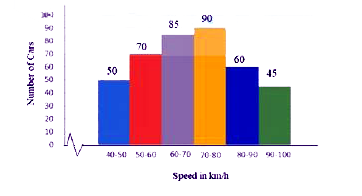
The number of cars with speed (km/h) in the interval (60 - 70) km/h is what percentage less than the number of cars with speed (km/h) in the interval (70-80) km/h? (correct to one decimal place)
View SolutionThe following graph represents the transport used by children. Study the graph and answer the given questions.
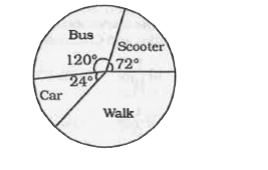
What is the percentage of children using scooter ?
View Solution
