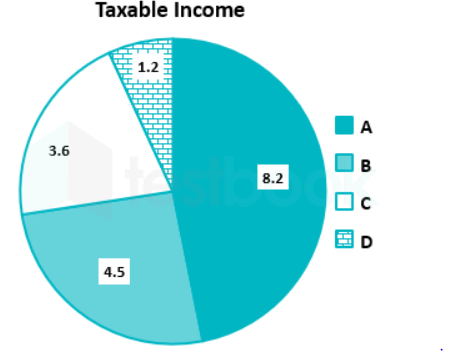
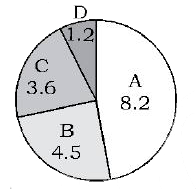
The given pie-chart shows the taxable income for A, B, C and D in lakhs of rupees.
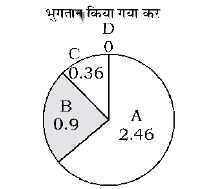
This chart shows the tax paid for the above taxable income by A, B, C and D in lakhs of rupees.
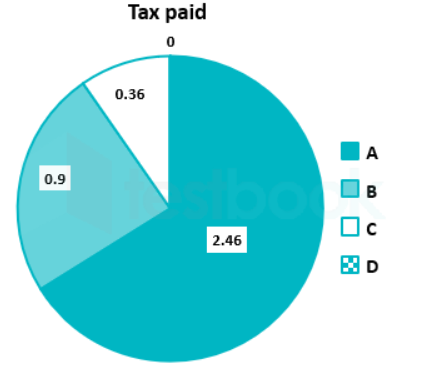
In the given pie-chart. what is the overall tax percentage for all four?
17.2%
15%
21.3%
19.5%
The correct Answer is:C
Step by step video & image solution for The given pie-chart shows the taxable income for A, B, C and D in lakhs of rupees. This chart shows the tax paid for the above taxable income by A, B, C and D in lakhs of rupees. In the given pie-chart. what is the overall tax percentage for all four? by Maths experts to help you in doubts & scoring excellent marks in Class 14 exams.
Updated on:21/07/2023Similar Questions
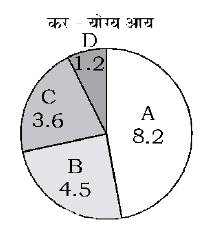
The given pie chart shows the taxable income for A,B , C and D in lakhs of rupees
This chart shows the tax paid for the above taxable income by A, B , C and D in lakhs of rupees
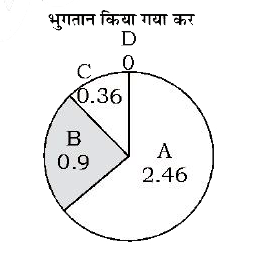
In the given pie chart what is overall tax percentage for all four?
View SolutionThe given pie-chart shows the taxable income for A, B, C and D in lakhs of rupees.

This chart shows the tax paid for the above taxable income by A, B, C and D in lakhs of rupees.

In the given pie-chart, what is the percentage of tax charged for A?
View SolutionThe given pie-chart shows the taxable income for A, B, C and D in lakhs of rupees.

This chart shows the tax paid for the above taxable income by A, B, C and D in lakhs of rupees.

In the given pie-chart, what is the percentage of tax charged for A?
View SolutionThe given pie chart shows the taxable income for A , B , C and D in lakhs of rupees
This chart shows the tax paid for the above taxable income by A, B , C and D in lakhs of rupees
IN the given pie chart what is the percentage of tax charged of A
View SolutionThe given pie chart shows the taxable income for A B C and D in lakhs of rupees.
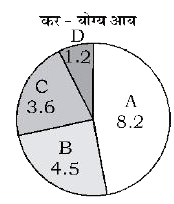
This chart shows the tax paid for the above taxable income by A , B C and D in lakhs of rupees
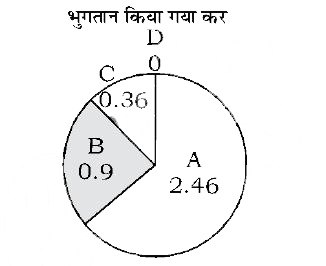
In the given pie chart if B taxable was 12% more how much tax would he have paid then
View SolutionThe given pie-chart shows runs scored by A in 6 matches.
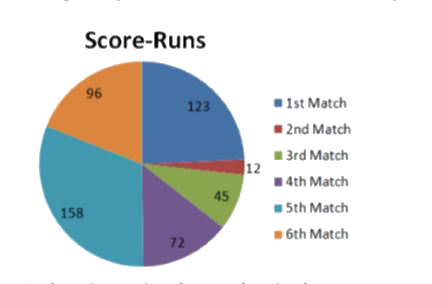
In the given pie-chart. what is the average runs scored in all matches? (rounded off)
View SolutionThe given pie chart shows runs scored by A in 6 matches
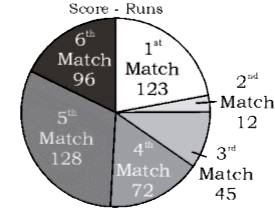
In the given pie chart what is the average runs scored in all matches
View SolutionThe given pie-chart shows favourite sport of students of a school.
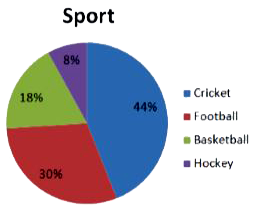
In the given pie-chart, what is the difference in percentage between liking for football and basketball?
View SolutionIdentify A,B,C and D in given flow chart:-
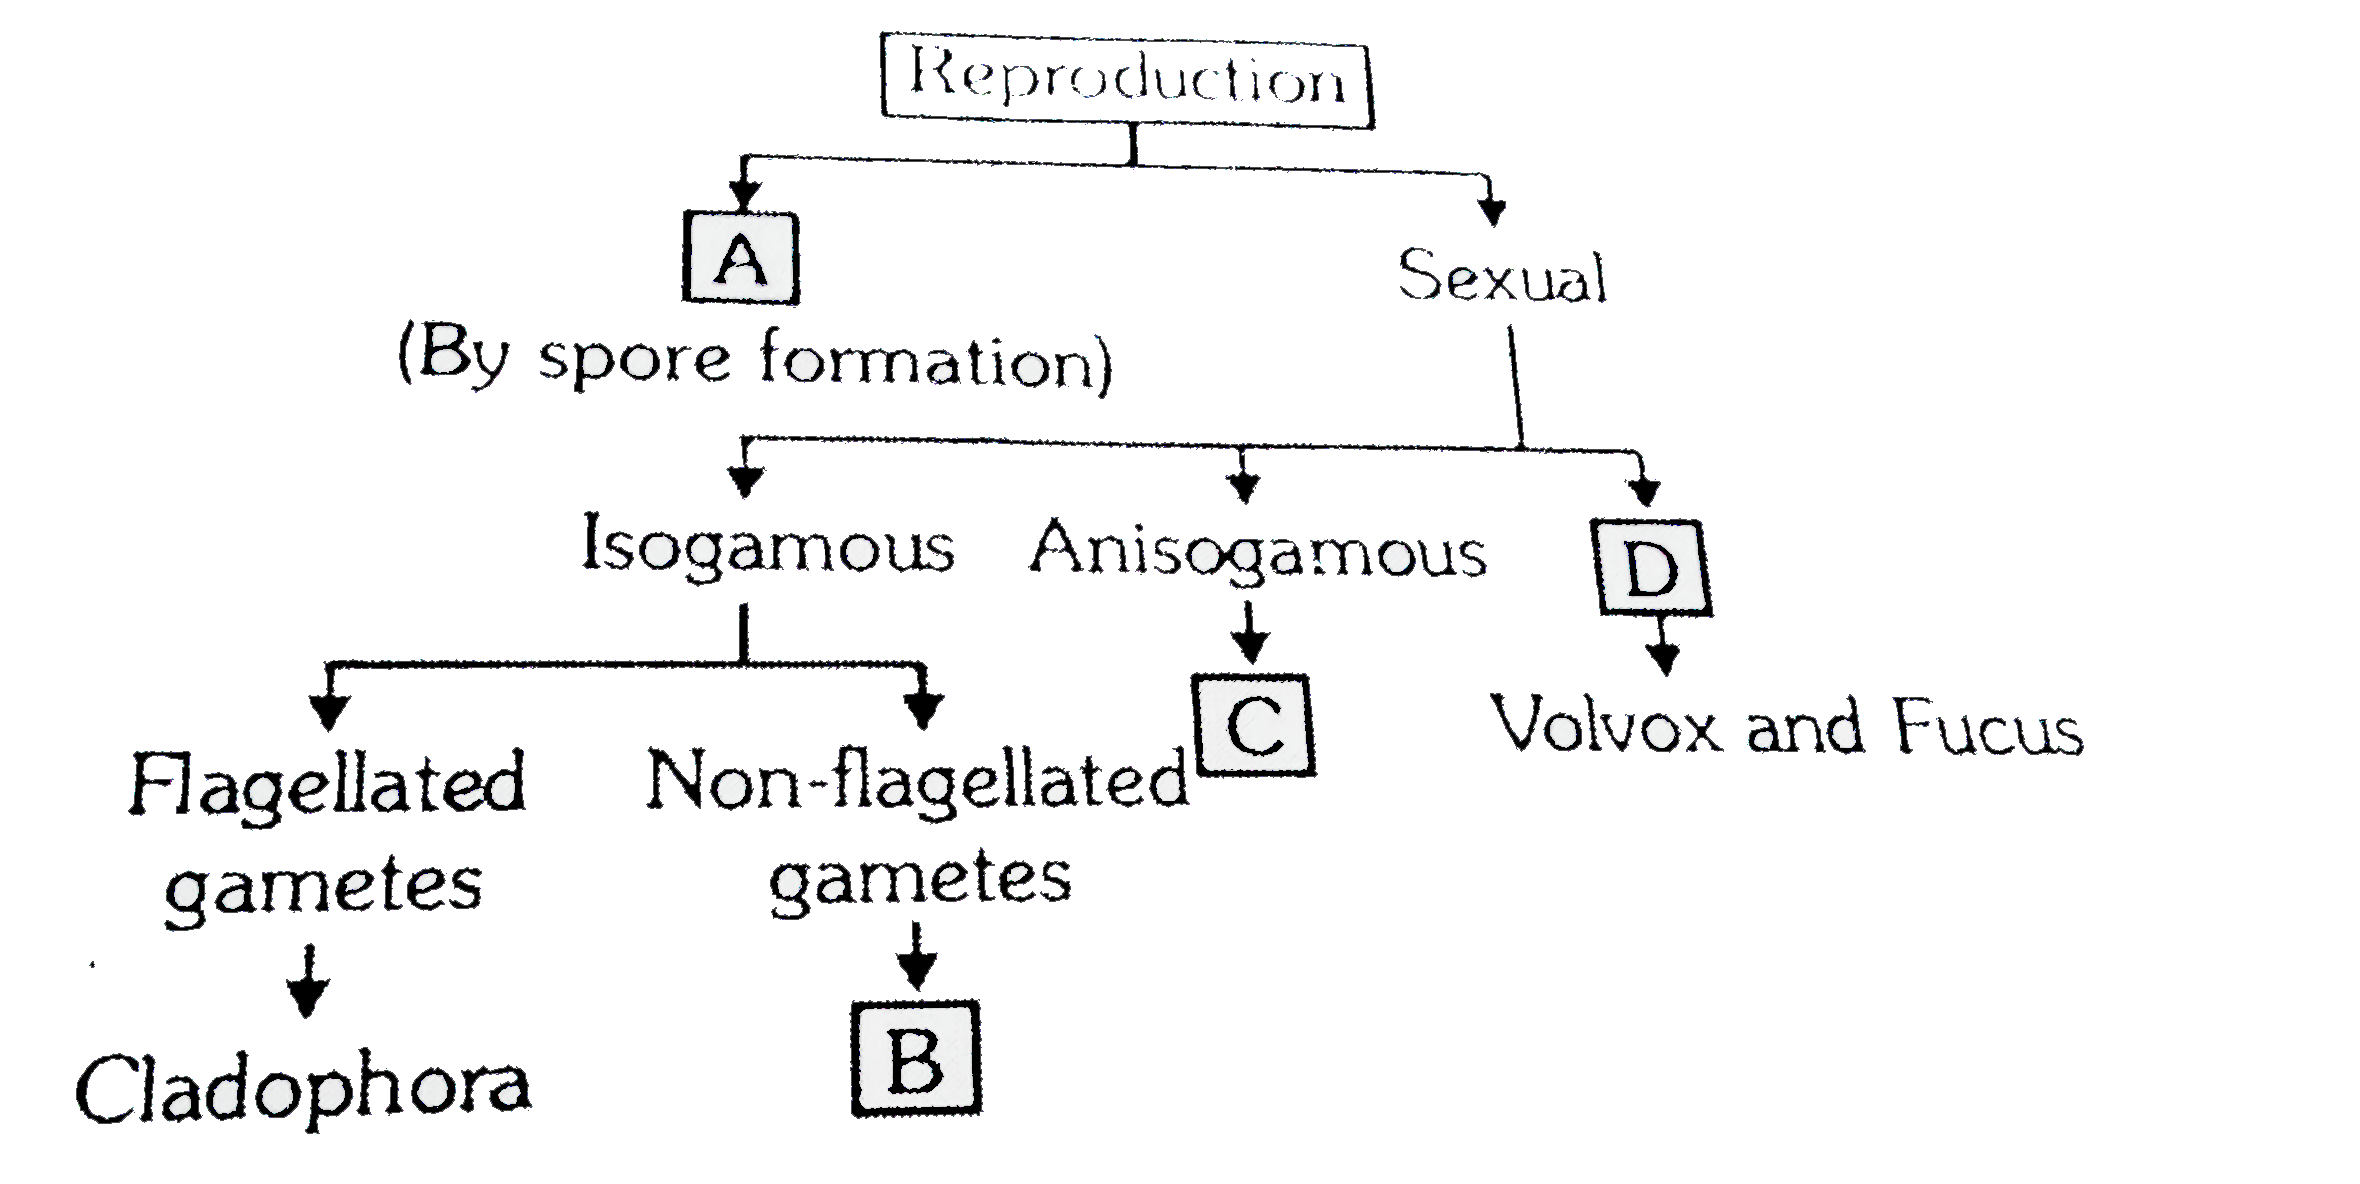
View SolutionThe given pie chart shows favorite shows of student of a school
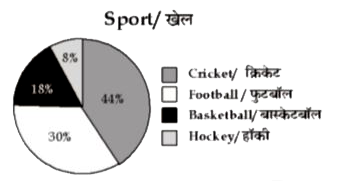
In the given pie chart, what is the difference in percentage between liking for football and basketball
View Solution
