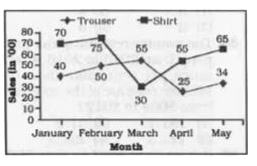
The line chart given below represents the sales (in 00) of trousers and shirts for five months .
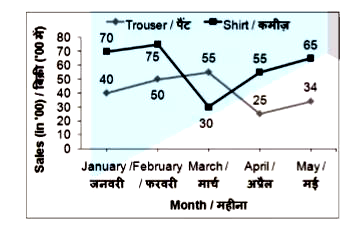
What is the difference between sales of shirts for months January and March?
2700
3500
1500
4500
The correct Answer is:A
Step by step video & image solution for The line chart given below represents the sales (in 00) of trousers and shirts for five months . What is the difference between sales of shirts for months January and March? by Maths experts to help you in doubts & scoring excellent marks in Class 14 exams.
Updated on:21/07/2023Similar Questions
The line chart given below represents the sales ( in 00) of trousers and shirts for five months .
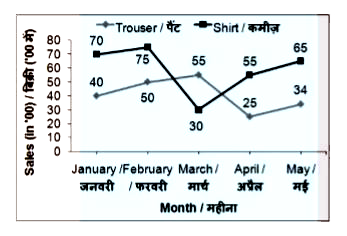
What is the percentage decrease in the sales of the trousers from February to March?
View SolutionThe line chart given below represents the sales (in 00) of trousers and shirts for five months.
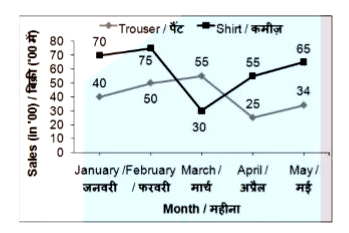
In January sale of is what trousers percent of sale of Shirts ?
View Solution
Knowledge Check
The line chart given blow represents the sales (in 00) of trousers ans shirts for five months.
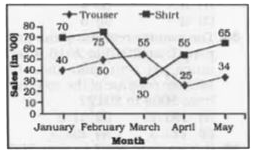
What is the difference between sales of shirts for months January and April?A2700B1500C2000D2200The line chart given blow represents the sales (in 00) of trousers ans shirts for five months.
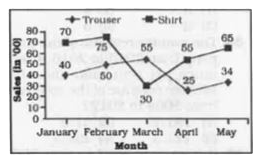
In March sale of trousers is what per cent of sale of shirts?A83.33B54.54C125D183.33The line chart given blow represents the sales (in 00) of trousers ans shirts for five months.
What is the percentage increase in the sales of the trousers from January to February?A25B20C10D28
The given bar graph represents the sale of cars in five different states in a month.
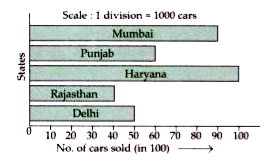 What is the difference between the numbre of cars sold in Mumbai and Punjab ?
View SolutionThe line chart given blow represents the sales (in 00) of trousers ans shirts for five months.
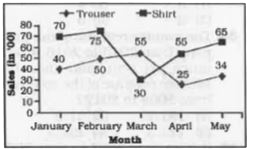
Total sale of shirts for five months is how much per cent more than the total sale of trousers for five months?
View SolutionThe bar chart given below shows the sales (in crores) of 2 companies A and B from years 2010 to 2015.
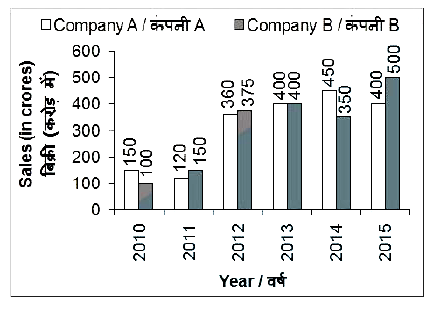
What is the difference (in crores) between the sales of company A in 2012 and company B in 2015?
View SolutionThe line chart given below shows the sales (in crores) of a company for the years 2009 to 2016
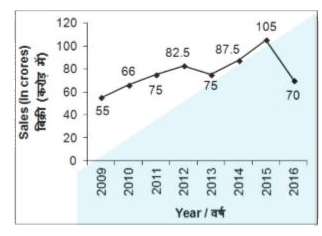
What is the average sale of the company from year 2009 to 2015?
View SolutionThe line chart given below shows the production (in 10000s) of cars in 7 different months.
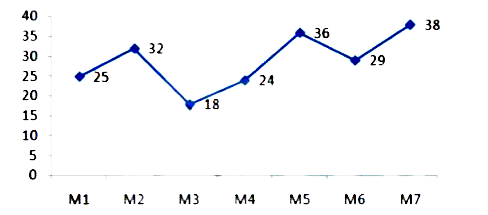
What is the average monthly production for the given 7 months?
View Solution
