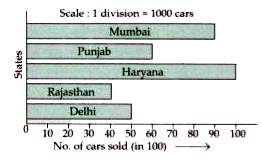
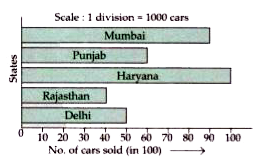
The given bar graph represents the sale of cars in five different states in a month.
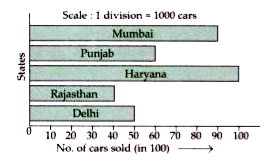 What is the difference between the numbre of cars sold in Mumbai and Punjab ?
The correct Answer is:Mumbai - 9000, Punjab - 3000
Step by step video & image solution for The given bar graph represents the sale of cars in five different states in a month. What is the difference between the numbre of cars sold in Mumbai and Punjab ? by Maths experts to help you in doubts & scoring excellent marks in Class 6 exams.
Updated on:21/07/2023Topper's Solved these Questions
- DATA HANDLING BOOK - MTG IIT JEE FOUNDATIONCHAPTER - DATA HANDLING EXERCISE - Solved Examples
37 Videos
- DATA HANDLING BOOK - MTG IIT JEE FOUNDATIONCHAPTER - DATA HANDLING EXERCISE - NCERT Section (Exercise 9.1)
22 Videos
- BASIC GEOMETRICAL IDEASBOOK - MTG IIT JEE FOUNDATIONCHAPTER - BASIC GEOMETRICAL IDEASEXERCISE - OLYMPIAD/HOTS CORNER
10 Videos
- DECIMALSBOOK - MTG IIT JEE FOUNDATIONCHAPTER - DECIMALSEXERCISE - OLYMPIAD/HOTS CORNER
20 Videos
Similar Questions
Knowledge Check
The Bar graph given below presentes the number of cars parked on ten different days in a parking area.
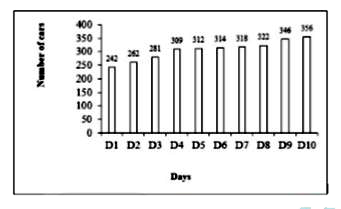
What is the difference in the number of cars parked on D3 and D8 ?A41B33C37D45The line chart given blow represents the sales (in 00) of trousers ans shirts for five months.
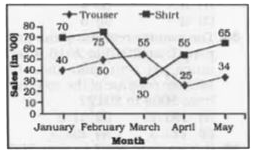
What is the difference between sales of shirts for months January and April?A2700B1500C2000D2200If number of cars sold of model C are 22000, then what will be the difference in the number of cars sold of model A and B?
A800B1200C1000D1500
What is the difference between a bar graph and a histogram
View SolutionThe line chart given below represents the sales (in 00) of trousers and shirts for five months .
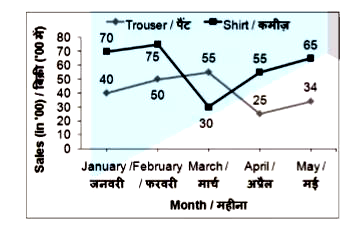
What is the difference between sales of shirts for months January and March?
View SolutionThe given bar graph shows number of cars washed by five friends to raise money for local children hospital.
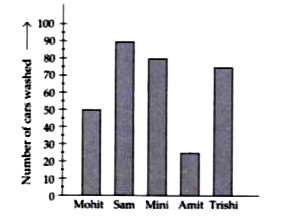
What is the difference between the number of cars washed by (Trishi and Sam) & (Mohit and Mini) ?
View SolutionRead the following graph carefully and answer the questions given below.
Percentage of cars of 6 different models produced by a company in two years.
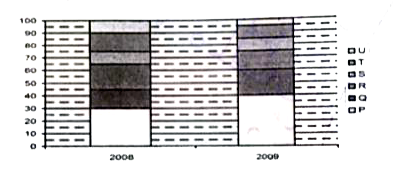
What is the difference between number of T model cars in year 2008 and 2009 ?
View SolutionThe Bar graph given below presents the number of cars parked on ten different days in a parking area
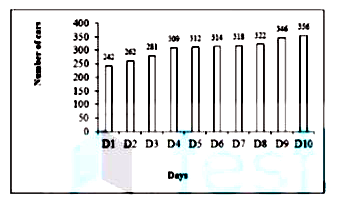
What is the total number of cars parked on all the ten days in the parking area ?
View Solution

