The given pie chart shows the stream wise distribution (in degrees) of the candidates who applied for an entrance exam. The total number of candidates who applied was 720000 and out of which 5400 have qualified the exam
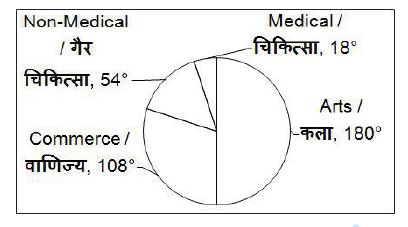
What percentage of the total candidates who applied for the exams have qualified it?
0.85
0.75
0.6
0.8
The correct Answer is:B
Step by step video, text & image solution for The given pie chart shows the stream wise distribution (in degrees) of the candidates who applied for an entrance exam. The total number of candidates who applied was 720000 and out of which 5400 have qualified the exam What percentage of the total candidates who applied for the exams have qualified it? by Maths experts to help you in doubts & scoring excellent marks in Class 14 exams.
Similar Questions
Knowledge Check
- Question 1 - Select One
The given pie chart shows the stream wise distribution (in degrees) of the candidates who applied for an entrance exam. The total number of candidates who applied was 720000 and out of which 5400 have qualified the exam
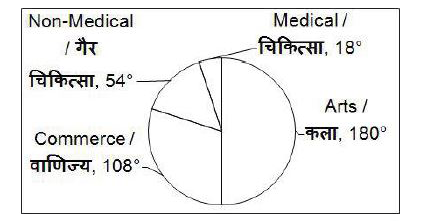
What percentage of the total candidates belong the non-medical?A18%B8.33%C15%D14.28% - Question 2 - Select One
The given pie chart shows the stream wise distribution (in degrees) of the candidates who applied for an entrance exam. The total number of candidates who applied was 720000 and out of which 5400 have qualified the exam
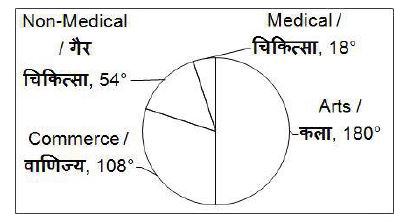
What is the average of the total candidates from Arts, Commerce and Non-medical?A216000B296000C260000D228000 - Question 3 - Select One
The given pie chart shows the stream wise distribution (in degrees) of the candidates who applied for an entrance exam. The total number of candidates who applied was 720000 and out of which 5400 have qualified the exam
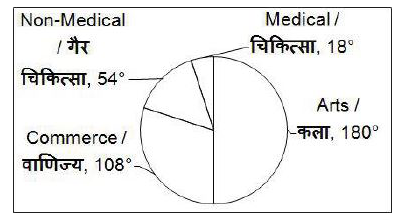
What is the respective ratio of the Arts candidates and Commerce candidates?A3:1B2:1C5:3D7:5
From which zone was the total number of candidates who qualified the test, the second highest in the year? P (b) Q (c) R (d) S (e) T
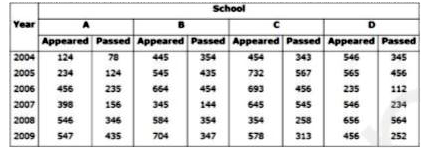
View SolutionWhat was the respective ratio between the number of candidates who appeared from school -C in the year 2006 and the number of candidate who passed in the exam from school - D in the year 2009 ?
 View Solution
The given pie chart shows the stream wise distribution (in degrees) of the candidates who applied for an entrance exam. The total number of candidates who applied was 720000 and out of which 5400 have qualified the exam
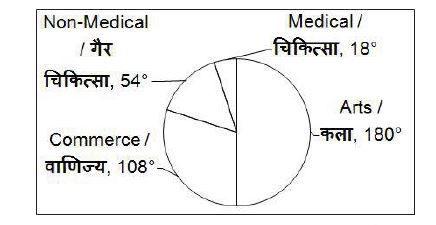
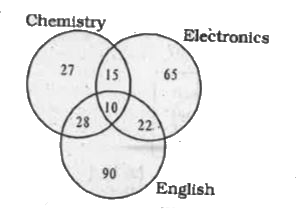
If from medical and non-medical both, 1.3% candidates have qualified the exam, then how many candidates have qualified the exam from commerce and arts in total?View SolutionThe diagram gives the number of candidates who failed in Chemistry, Electronics and English in different tests. The total number of candidates appeared was 600. What is the percentage of candidates who failed in at least two subject?
 View Solution
the following examination shows the analysis of the result of an examination in which 5 candidates have failed. The total number of examinees was
 View Solution


