The given pie chart shows the monthly expenditure on various items and monthly savings of a household. The same distribution is followed for all the months of the year.
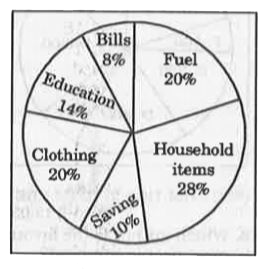
If monthly income is Rs. 50000, then how much is spent (in Rs.) on fuel?
12000
10000
13500
15000
The correct Answer is:B
Step by step video, text & image solution for The given pie chart shows the monthly expenditure on various items and monthly savings of a household. The same distribution is followed for all the months of the year. If monthly income is Rs. 50000, then how much is spent (in Rs.) on fuel? by Maths experts to help you in doubts & scoring excellent marks in Class 14 exams.
Updated on:21/07/2023Similar Questions
Directions : The pie-chart given below shows expenditure incurred by a family on various items and their savings. Study the chart and answer the questions based on the pie-chart
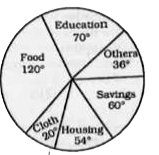
If the monthly income is Rs. 36000, then the yearly saving is :
View SolutionThe given pie chart shows the monthly expenditure on various items and monthly savings of a household. The same distribution is followed for all the months of the year.
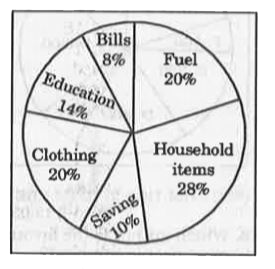
If an amount of Rs. 2400 is saved per month, then what is the monthly salary (in Rs.) of the household ?
View Solution
Knowledge Check
The given pie chart shows the monthly expenditure on various items and monthly savings of a household. The same distribution is followed for all the months of the year.
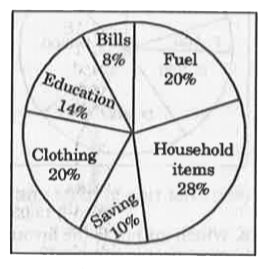
If monthly income is Rs. 65000, then what is the difference ()in Rs.) between expenditure on household items and clothing?A5200B6500C7200D4500The given pie chart shows the monthly expenditure on various items and monthly savings of a household. The same distribution is followed for all the months of the year.

If monthly income is Rs. 65000, then what is the difference ()in Rs.) between expenditure on household items and clothing?A5200B6500C7200D4500The given pie chart shows the monthly expenditure on various items and monthly savings of a household. The same distribution is followed for all the months of the year.

If an amount of Rs. 2400 is saved per month, then what is the monthly salary (in Rs.) of the household ?A24000B20000C30000D18000
The given pie chart shows the monthly expenditure on various items and monthly savings of a household. The same distribution is followed for all the months of the year.
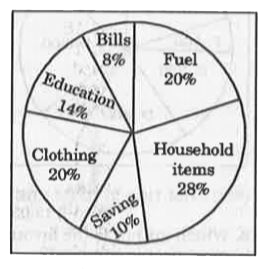
If the difference in monthly expenditure on fuel and bills is Rs. 4800, then what is the annual income of household?
View SolutionThe given pie chart shows the monthly expenditure on various items and monthly savings of a household. The same distribution is followed for all the months of the year.
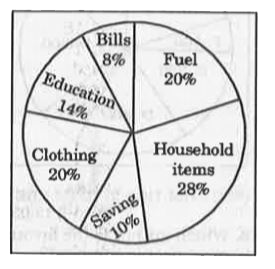
If the difference in monthly expenditure on clothing and education is Rs. 9000, then what is the different (in Rs.) in yearly saving and yearly expenditure on bills?
View SolutionThe given pie chart shows the monthly expenditure on various items and monthly savings of a household. The same distribution is followed for all the months of the year.

If the difference in monthly expenditure on fuel and bills is Rs. 4800, then what is the annual income of household?
View SolutionThe given pie chart shows the monthly expenditure on various items and monthly savings of a household. The same distribution is followed for all the months of the year.

If the difference in monthly expenditure on clothing and education is Rs. 9000, then what is the different (in Rs.) in yearly saving and yearly expenditure on bills?
View SolutionThe following pie-chart shows the monthly expenditure of a family on various items. If the family spends Rs. 825 on clothing, answer the question
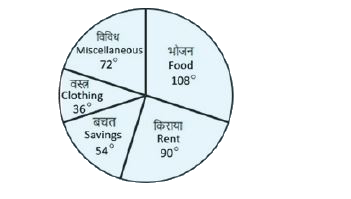
What is the total monthly income of the family?
View Solution
