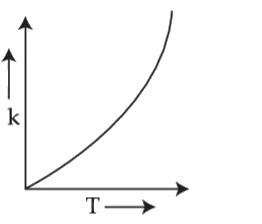
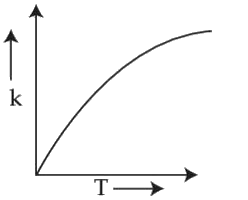
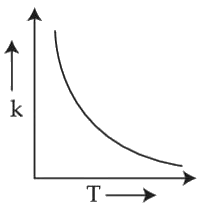
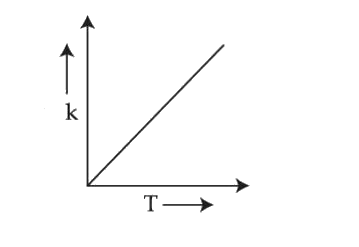
Which one of the following given graphs represents the variation of rate constant (k) with temperature (t) for an endothermic reaction ?
To determine the variation of the rate constant (k) with temperature (T) for an endothermic reaction, we can follow these steps:
1. Understand the Arrhenius Equation:
The Arrhenius equation is given by:
k=Ae−EaRT
where:
- k is the rate constant,
- A is the pre-exponential factor,
- Ea is the activation energy,
- R is the gas constant,
- T is the temperature in Kelvin.
2. Identify the Nature of Endothermic Reactions:
For endothermic reactions, the enthalpy change (ΔH) is positive. This means that as the temperature increases, the effect of the exponential term e−EaRT will also increase, leading to an increase in the rate constant k.
3. Analyze the Effect of Temperature:
As temperature T increases, the term EaRT decreases because R is constant and T is increasing. This results in the exponent becoming less negative, thus increasing the value of k.
4. Graphical Representation:
- On a graph where the x-axis represents temperature (T) and the y-axis represents the rate constant (k), we expect to see an upward trend.
- Since the increase in k is not linear but exponential, the graph will show a curve that rises more steeply as temperature increases.
5. Select the Correct Graph:
Based on the above analysis, the graph that represents the variation of the rate constant (k) with temperature (T) for an endothermic reaction will show an exponential increase in k as T increases.
Conclusion:
The best representation of the variation of the rate constant (k) with temperature (T) for an endothermic reaction is an upward-sloping curve that increases exponentially.
The Arrhenius equation is given by:
k=Ae−EaRT
where:
- k is the rate constant,
- A is the pre-exponential factor,
- Ea is the activation energy,
- R is the gas constant,
- T is the temperature in Kelvin.
For endothermic reactions, the enthalpy change (ΔH) is positive. This means that as the temperature increases, the effect of the exponential term e−EaRT will also increase, leading to an increase in the rate constant k.
As temperature T increases, the term EaRT decreases because R is constant and T is increasing. This results in the exponent becoming less negative, thus increasing the value of k.
- On a graph where the x-axis represents temperature (T) and the y-axis represents the rate constant (k), we expect to see an upward trend.
- Since the increase in k is not linear but exponential, the graph will show a curve that rises more steeply as temperature increases.
Based on the above analysis, the graph that represents the variation of the rate constant (k) with temperature (T) for an endothermic reaction will show an exponential increase in k as T increases.
The best representation of the variation of the rate constant (k) with temperature (T) for an endothermic reaction is an upward-sloping curve that increases exponentially.
Topper's Solved these Questions
- JEE MAINS 2021BOOK - JEE MAINS PREVIOUS YEARCHAPTER - JEE MAINS 2021EXERCISE - Chemistry Section B
20 Videos
- JEE MAINS 2021BOOK - JEE MAINS PREVIOUS YEARCHAPTER - JEE MAINS 2021EXERCISE - Chemistry (Section A)
80 Videos
- JEE MAINS 2021BOOK - JEE MAINS PREVIOUS YEARCHAPTER - JEE MAINS 2021EXERCISE - CHEMISTRY (SECTION-B)
40 Videos
- JEE MAINS 2020BOOK - JEE MAINS PREVIOUS YEARCHAPTER - JEE MAINS 2020EXERCISE - CHEMSITRY
25 Videos
- JEE MAINS 2022BOOK - JEE MAINS PREVIOUS YEARCHAPTER - JEE MAINS 2022EXERCISE - CHEMISTRY (SECTION-B)
10 Videos
Similar Questions
Knowledge Check
which of the following graph represents the variation of resistivity (ρ) with temperature (T) for copper?
A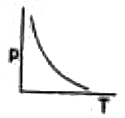 B
B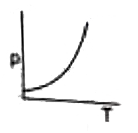 C
C D
D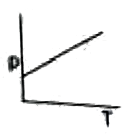
Which one of the following graphs represents variation of specific heat capacity of water with temperature?
A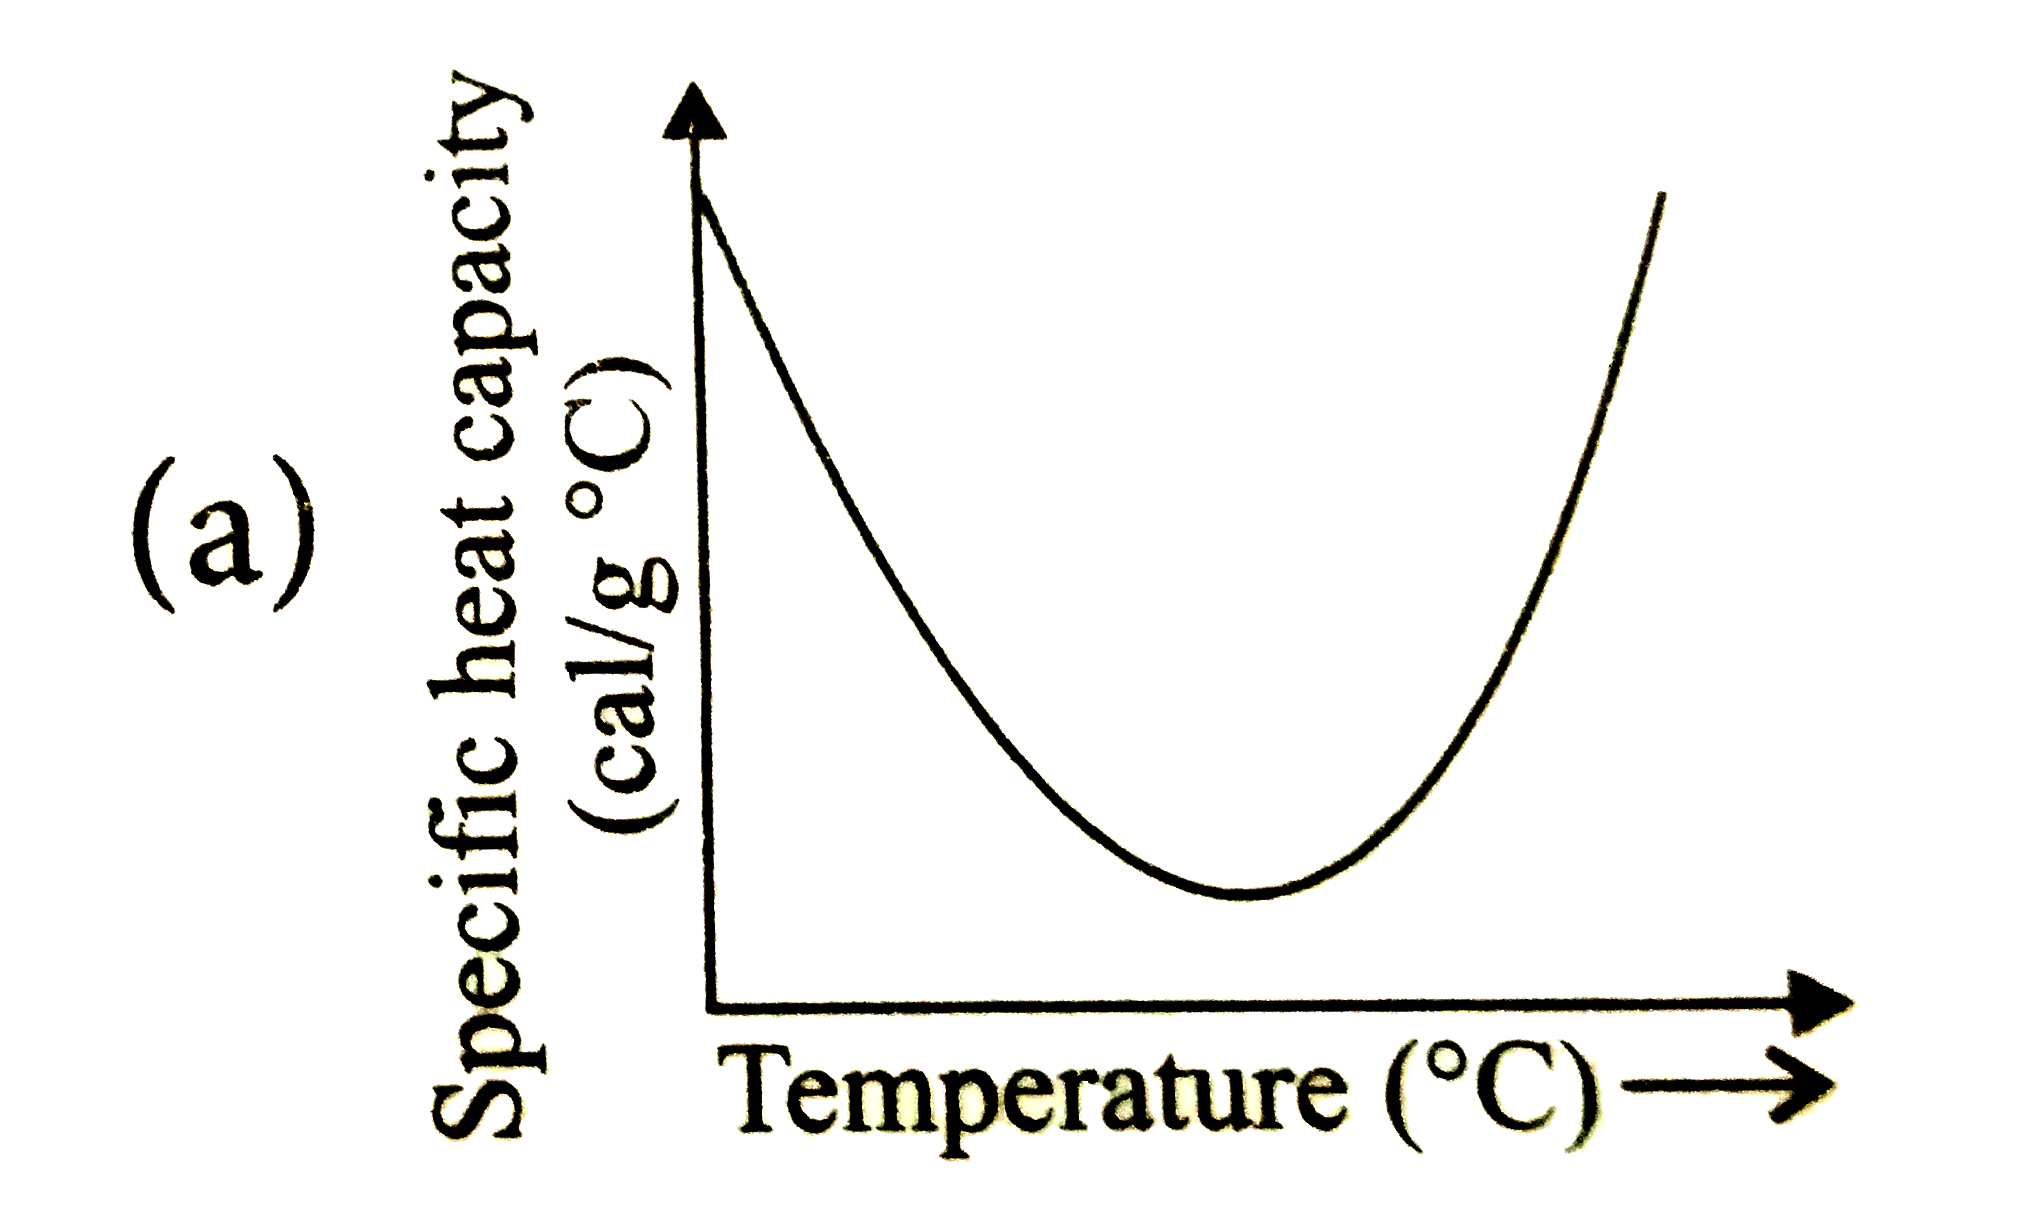 B
B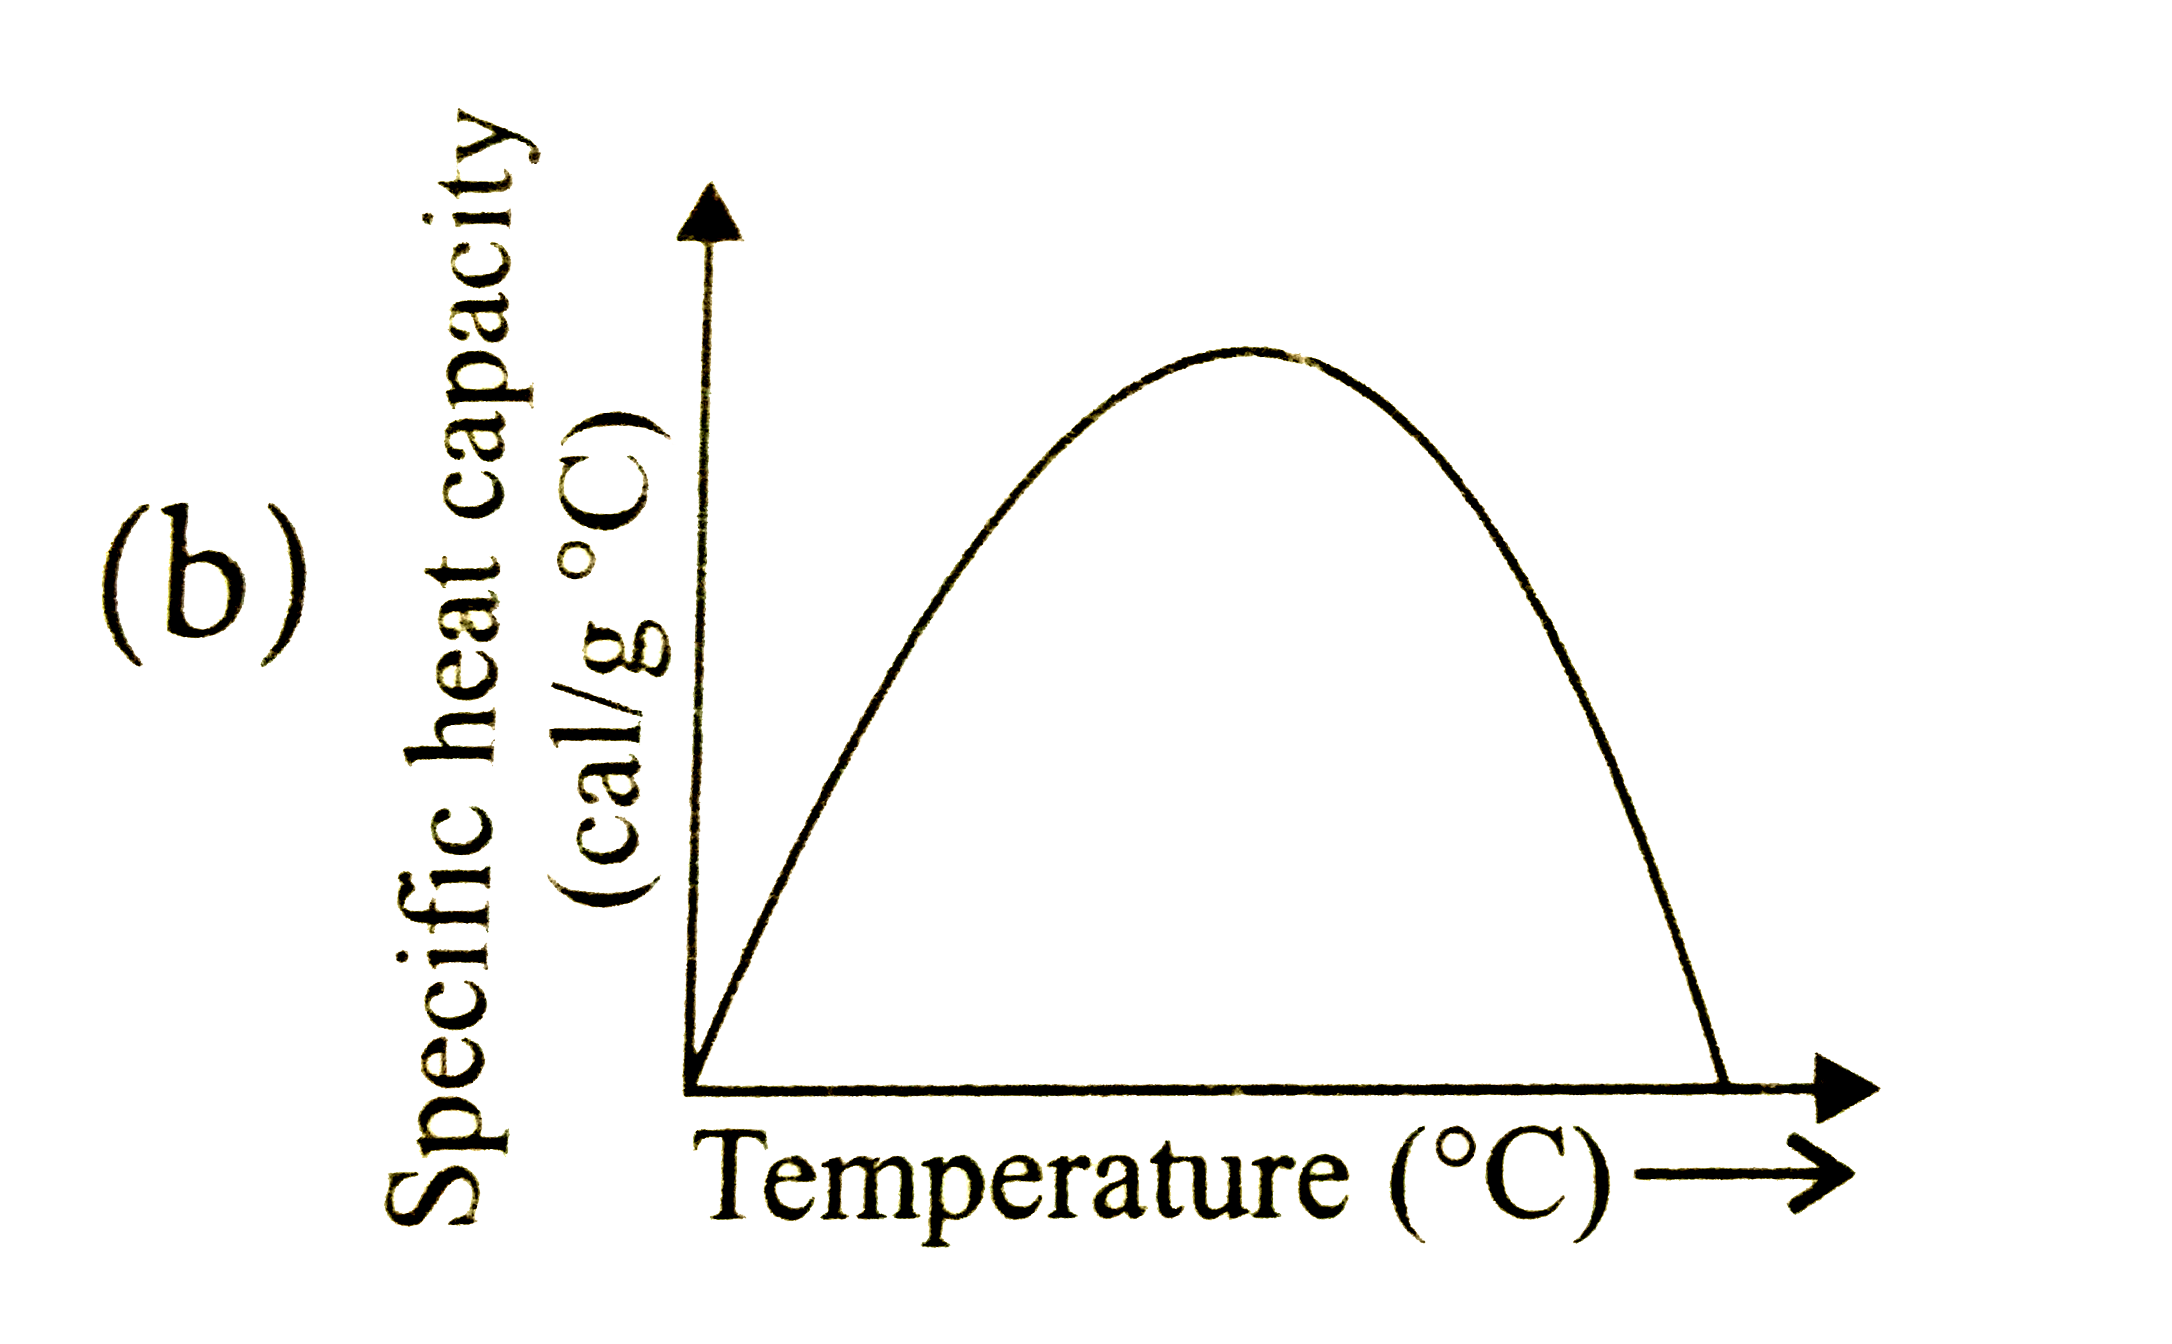 C
C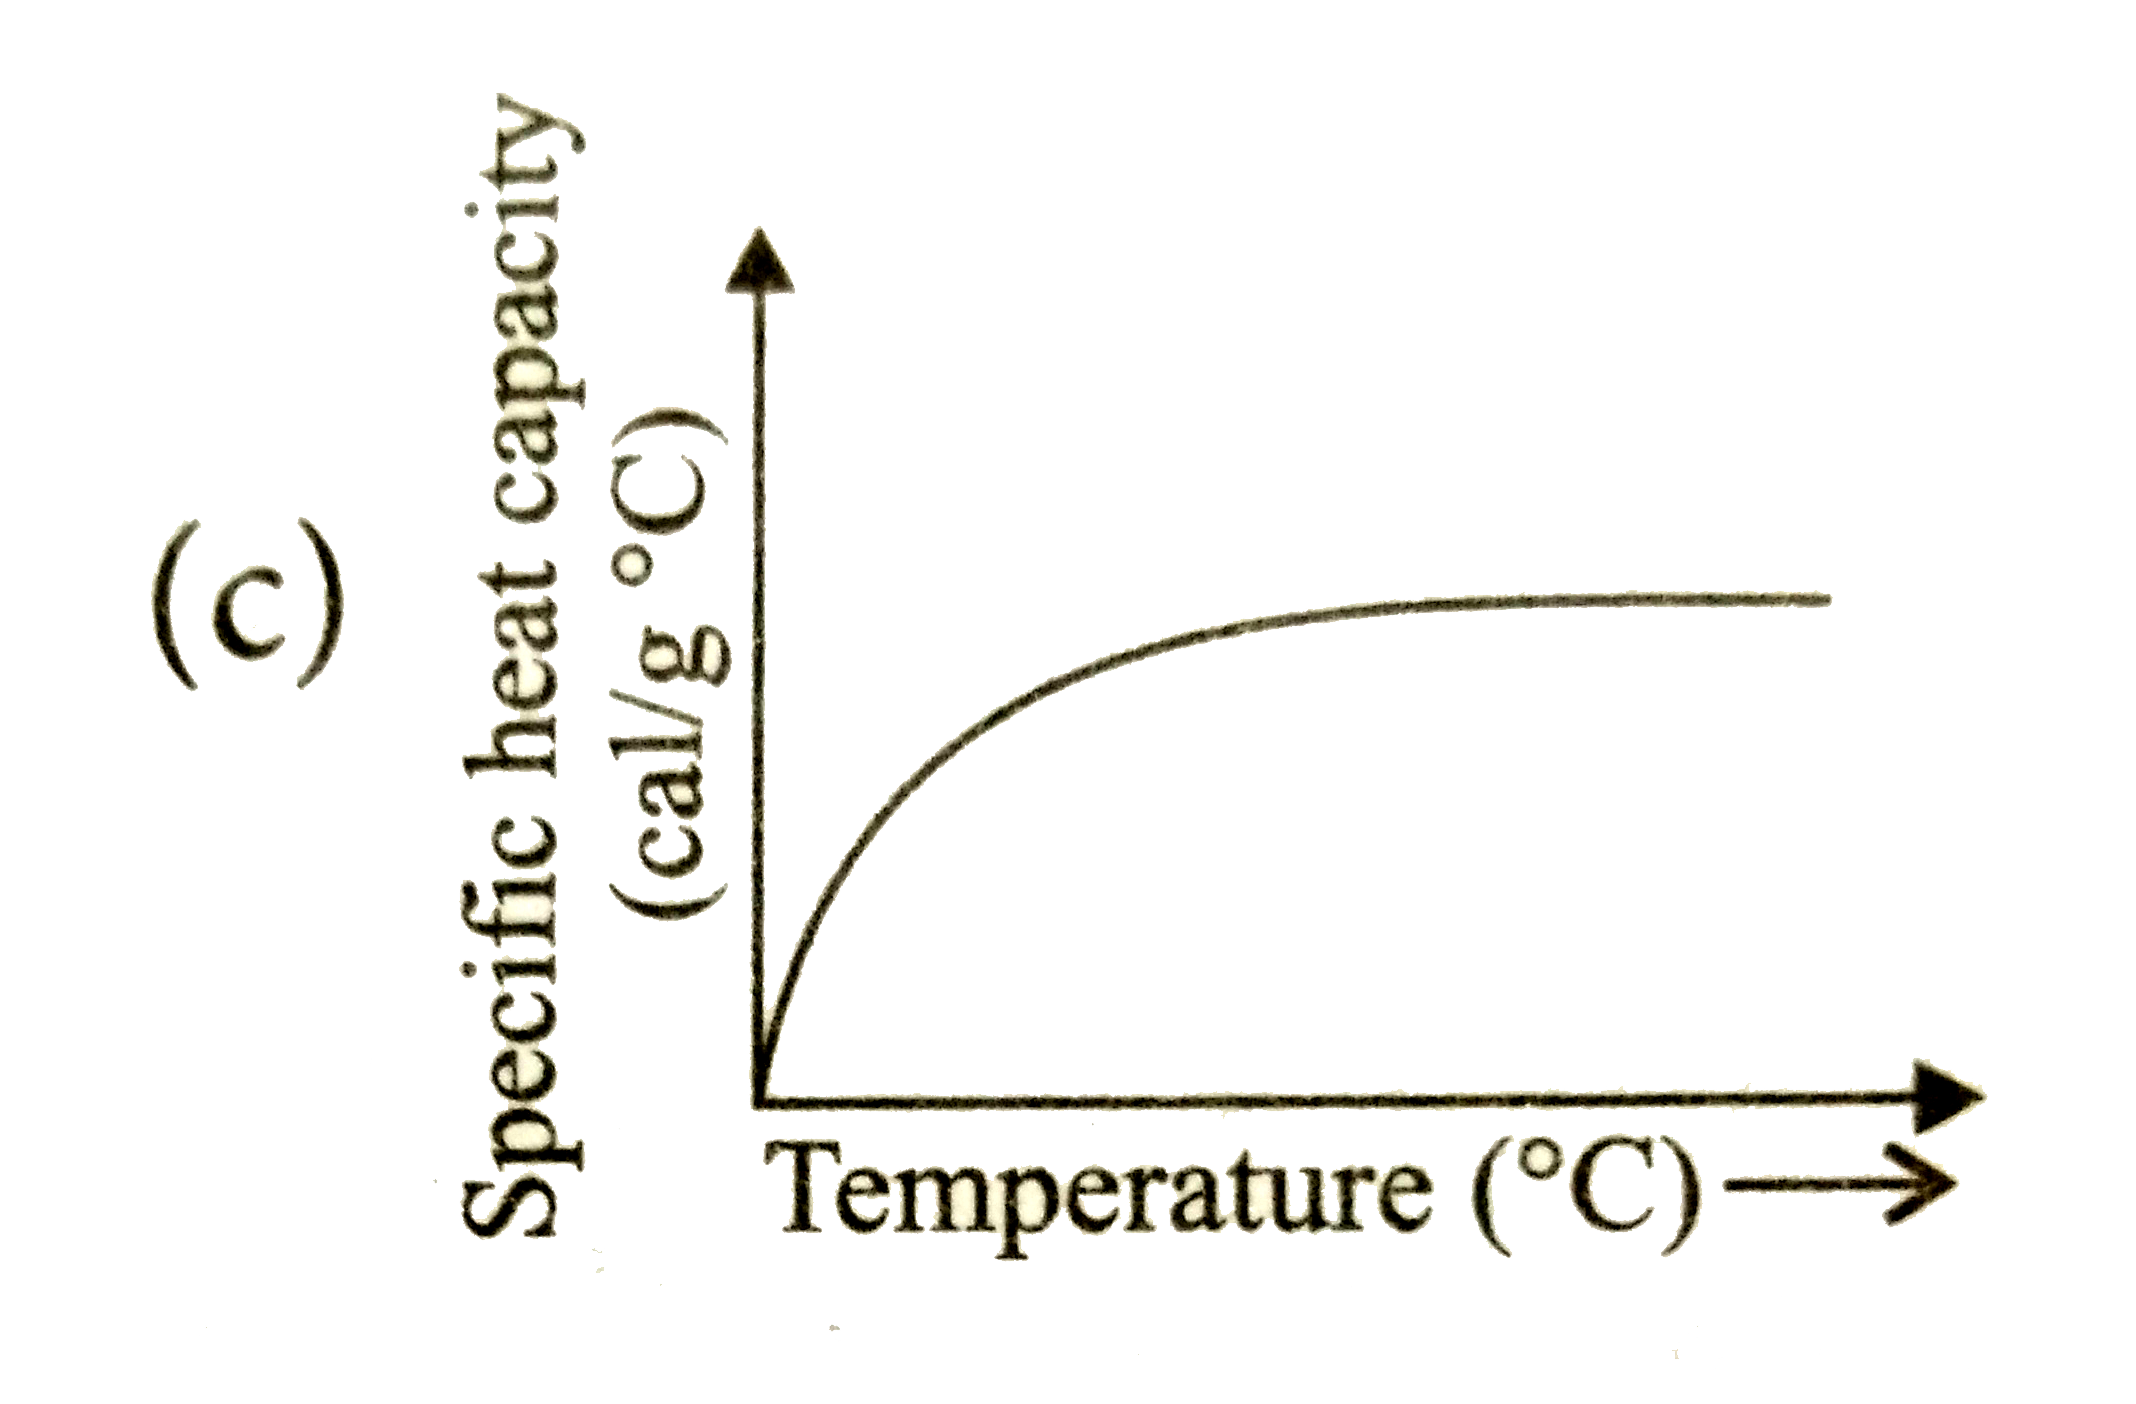 D
D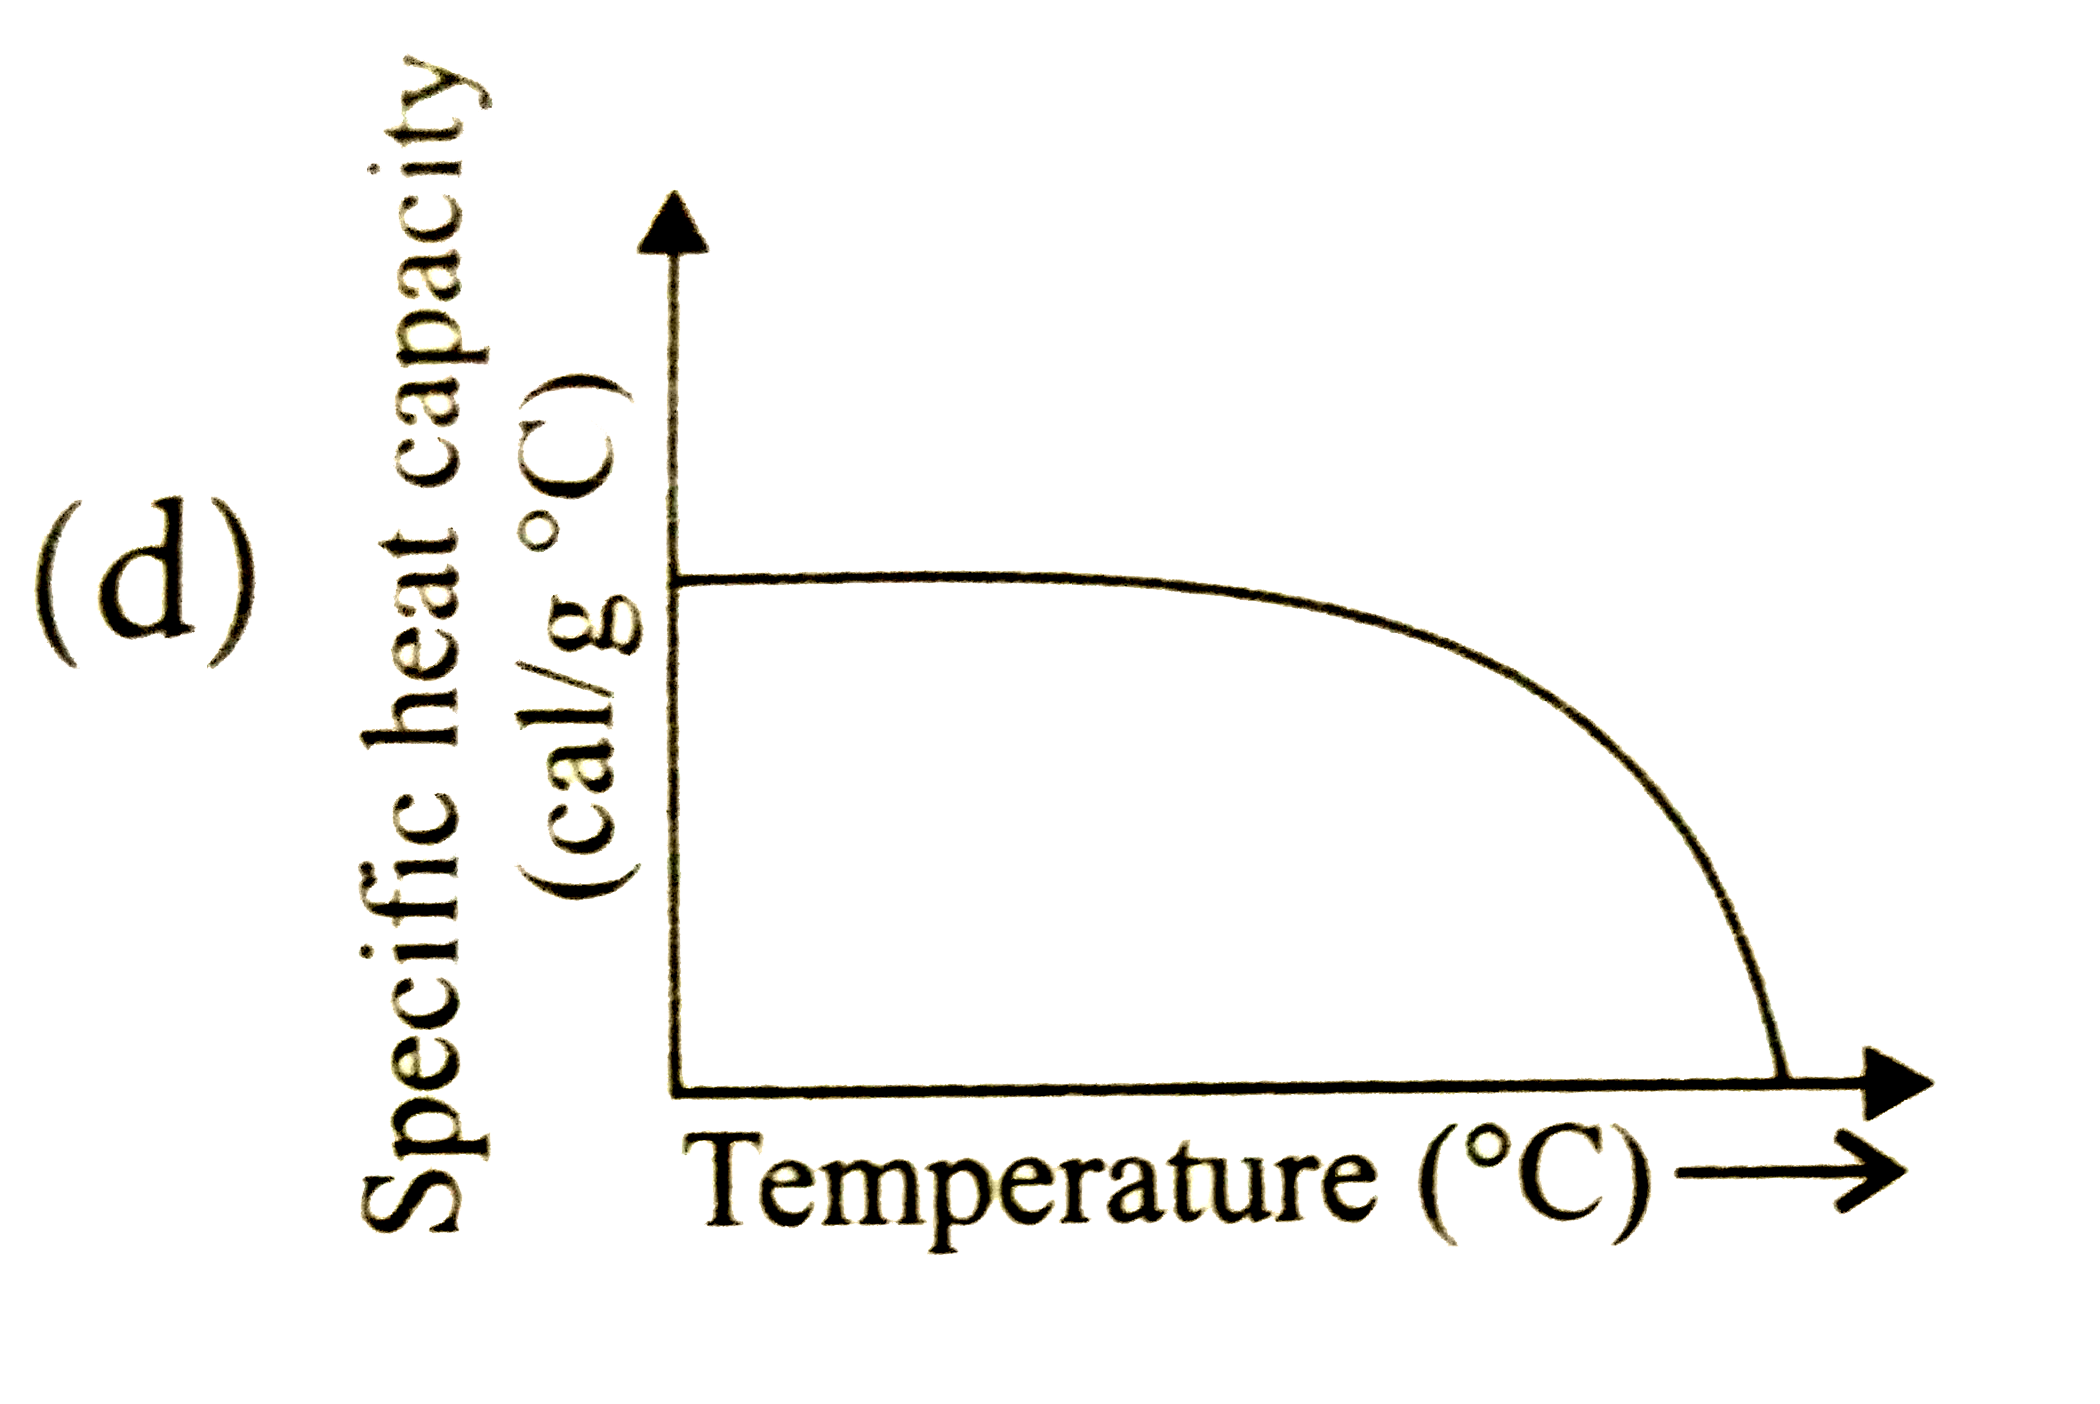
Which of the following graph is incorrect for variation of rate constant (K) with temperature for a reaction obeying Arrhenius equation ?
A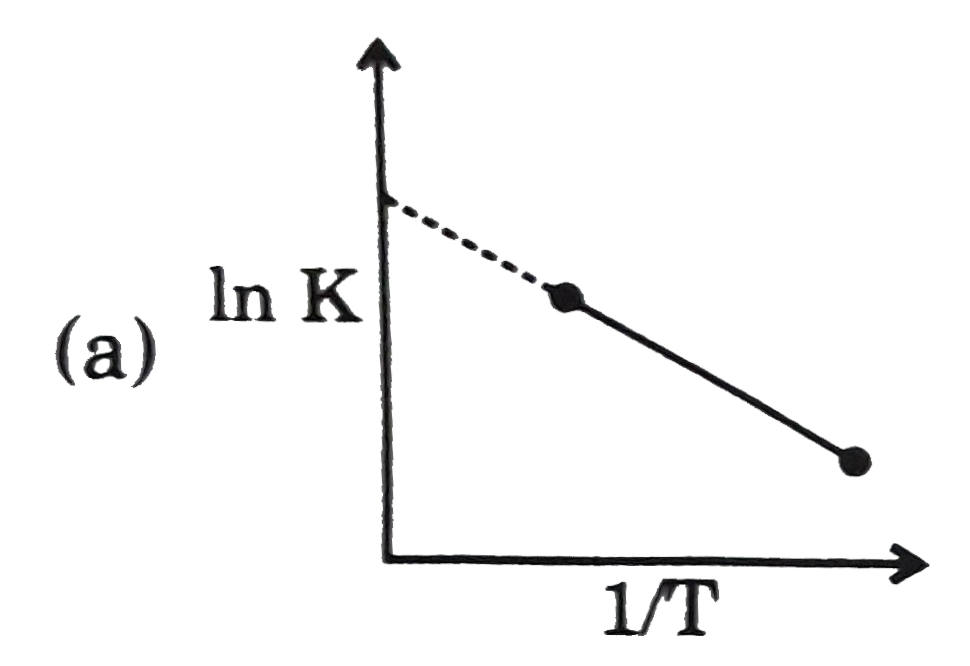 B
B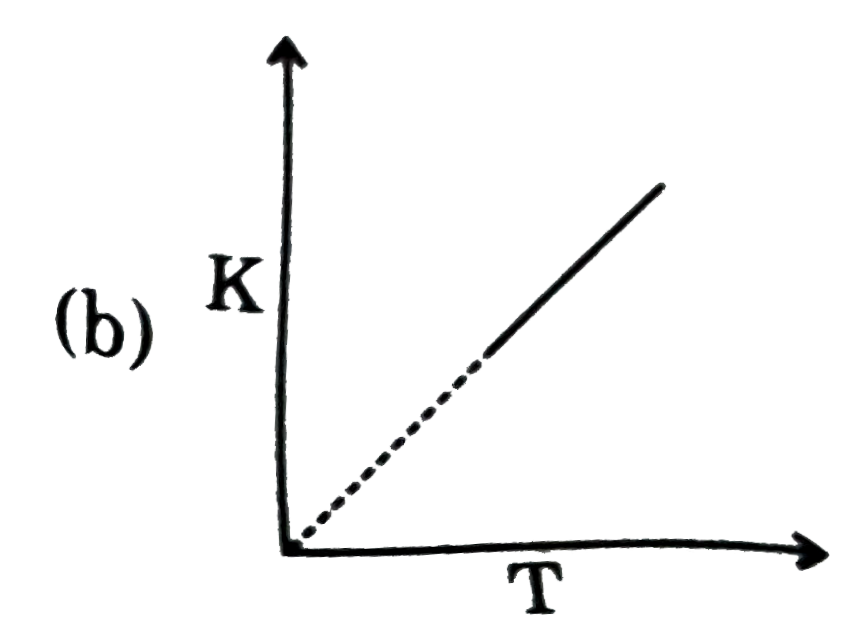 C
C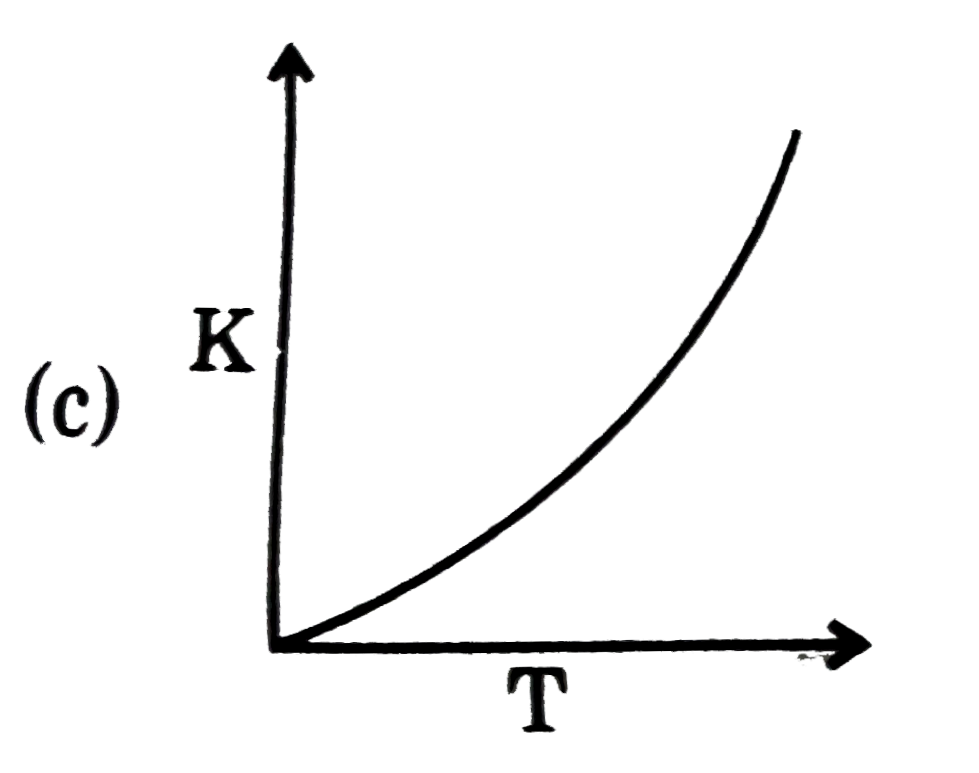 D
D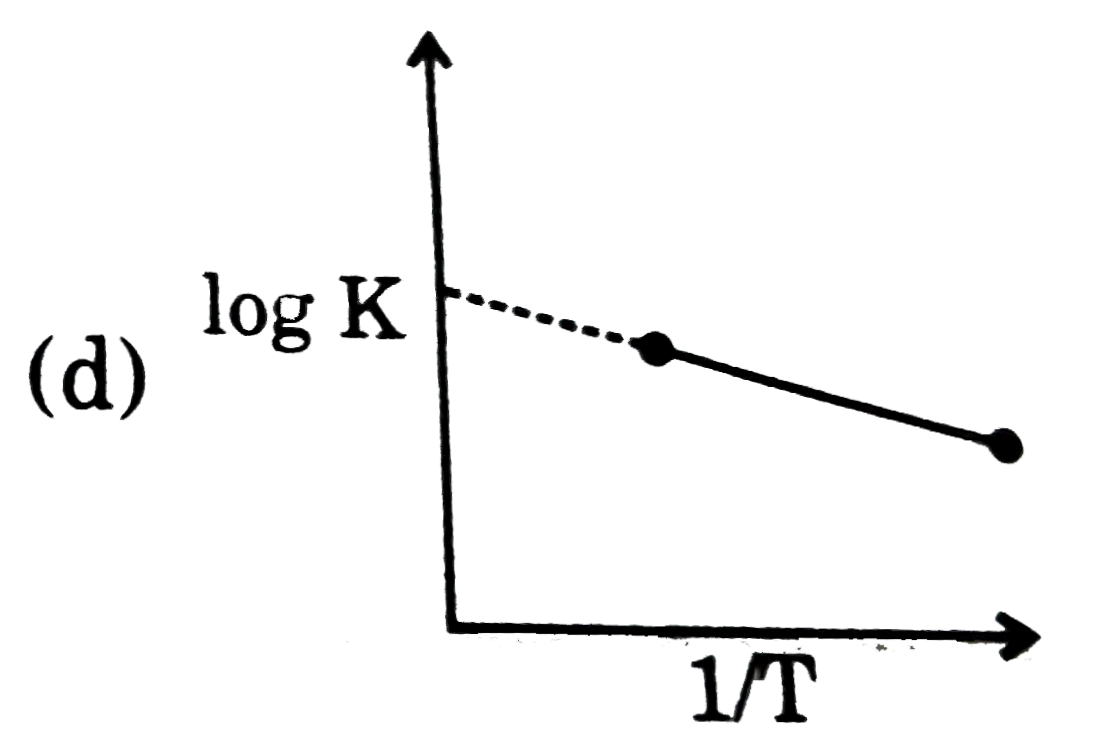
Which one of the following represents correctly the variations of surface tension with temperature θ ?
View SolutionWhich one of the following graphs represents the variation of surface tension of water with temperture for a small range of temperature ?
View SolutionWhich of the following graphs represents the variation of activity (A) of a radioactive substance with time (t).
View SolutionA body moves from rest with a constant acceleration. Which one of the following graphs represents the variation of its kinetic energy K with the distance travelled x?
View SolutionA body moves from rest with a constant acceleration. Which one of the following graphs represents the variation of its kinetic energy K with the distance travelled x?
View Solution