Which one of the following given graphs represents the variation of rate constant (k) with temperature (f) for an endothermic reaction ?
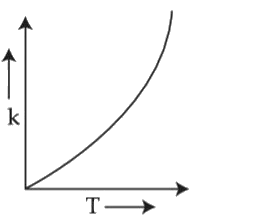
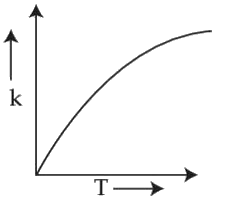
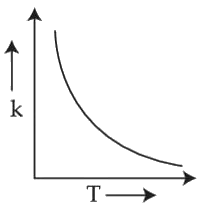
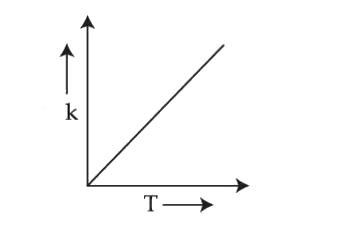
To determine which graph represents the variation of the rate constant (k) with temperature (T) for an endothermic reaction, we can follow these steps:
1. Understand the Relationship between k and Temperature:
For a chemical reaction, the rate constant (k) is related to temperature (T) through the Arrhenius equation:
k=Ae−EaRT
where Ea is the activation energy, R is the universal gas constant, and A is the pre-exponential factor.
2. Consider the Gibbs Free Energy Relation:
The Gibbs free energy change (ΔG) is related to the rate constant (k) by:
ΔG=−RTlnk
Additionally, we know:
ΔG=ΔH−TΔS
where ΔH is the change in enthalpy and ΔS is the change in entropy.
3. Equate the Two Expressions for ΔG:
Setting the two expressions for ΔG equal gives:
−RTlnk=ΔH−TΔS
4. Rearrange the Equation:
Dividing through by −RT leads to:
lnk=−ΔHRT+ΔSR
This can be rearranged to fit the form of a straight line:
lnk=−ΔHR⋅1T+ΔSR
5. Identify the Slope and Intercept:
From the equation, we see that:
- The slope (m) is −ΔHR (negative for endothermic reactions since ΔH>0).
- The y-intercept (c) is ΔSR (positive).
6. Graph Characteristics:
Since the slope is negative, the graph of lnk versus 1T will be a straight line that decreases as T increases. This indicates that as temperature increases, the rate constant k increases for an endothermic reaction.
7. Select the Correct Graph:
Based on the above analysis, we look for a graph that shows a straight line with a negative slope. The correct answer is the graph that represents this relationship.
Conclusion:
The correct graph that represents the variation of the rate constant (k) with temperature (T) for an endothermic reaction is Graph A.
For a chemical reaction, the rate constant (k) is related to temperature (T) through the Arrhenius equation:
k=Ae−EaRT
where Ea is the activation energy, R is the universal gas constant, and A is the pre-exponential factor.
The Gibbs free energy change (ΔG) is related to the rate constant (k) by:
ΔG=−RTlnk
Additionally, we know:
ΔG=ΔH−TΔS
where ΔH is the change in enthalpy and ΔS is the change in entropy.
Setting the two expressions for ΔG equal gives:
−RTlnk=ΔH−TΔS
Dividing through by −RT leads to:
lnk=−ΔHRT+ΔSR
This can be rearranged to fit the form of a straight line:
lnk=−ΔHR⋅1T+ΔSR
From the equation, we see that:
- The slope (m) is −ΔHR (negative for endothermic reactions since ΔH>0).
- The y-intercept (c) is ΔSR (positive).
Since the slope is negative, the graph of lnk versus 1T will be a straight line that decreases as T increases. This indicates that as temperature increases, the rate constant k increases for an endothermic reaction.
Based on the above analysis, we look for a graph that shows a straight line with a negative slope. The correct answer is the graph that represents this relationship.
The correct graph that represents the variation of the rate constant (k) with temperature (T) for an endothermic reaction is Graph A.
Topper's Solved these Questions
Similar Questions
Knowledge Check
which of the following graph represents the variation of resistivity (ρ) with temperature (T) for copper?
A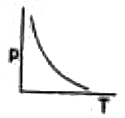 B
B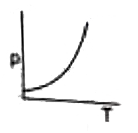 C
C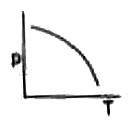 D
D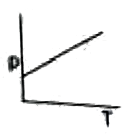
Which one of the following graphs represents variation of specific heat capacity of water with temperature?
A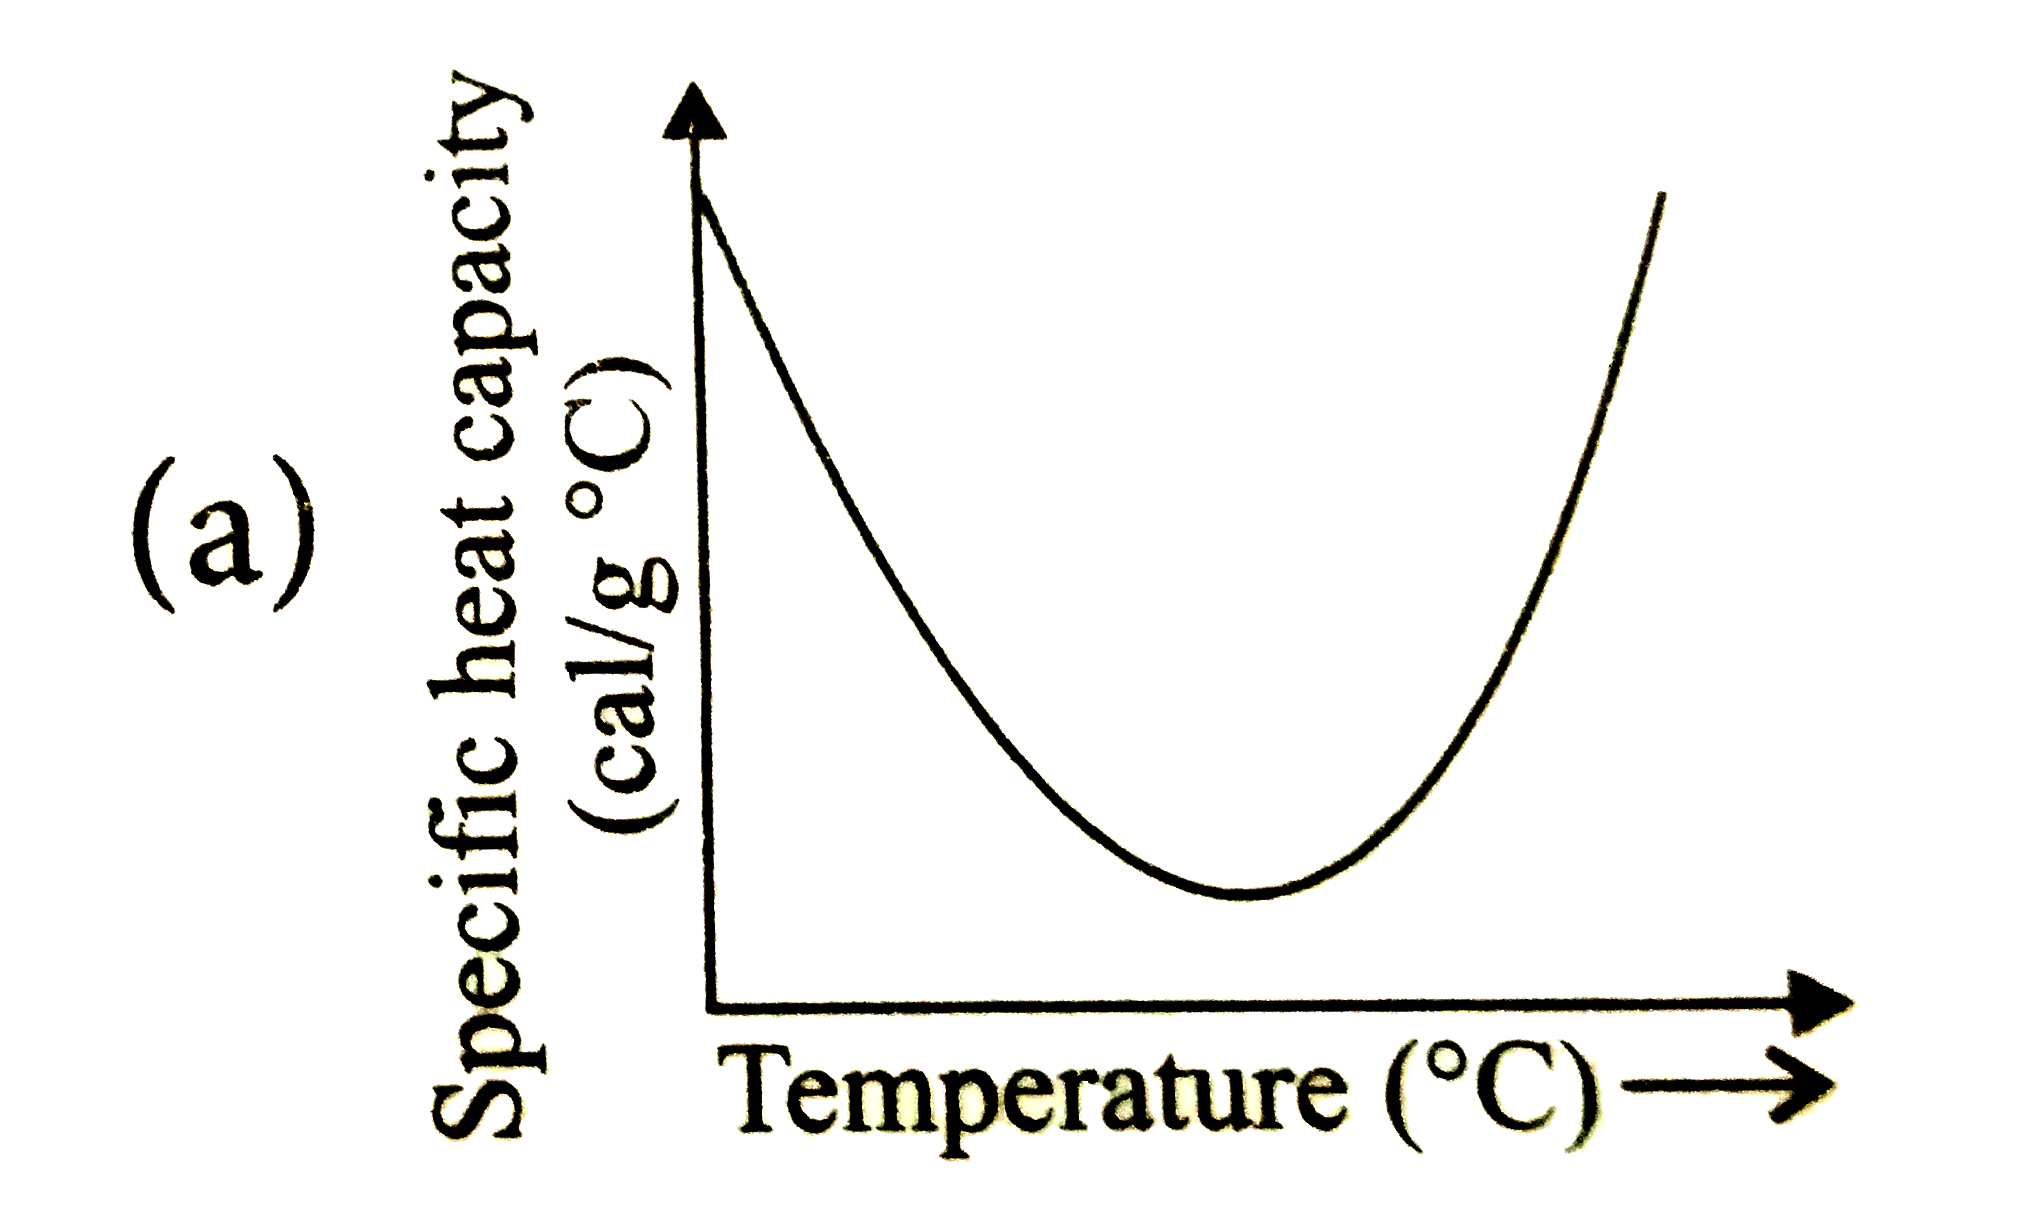 B
B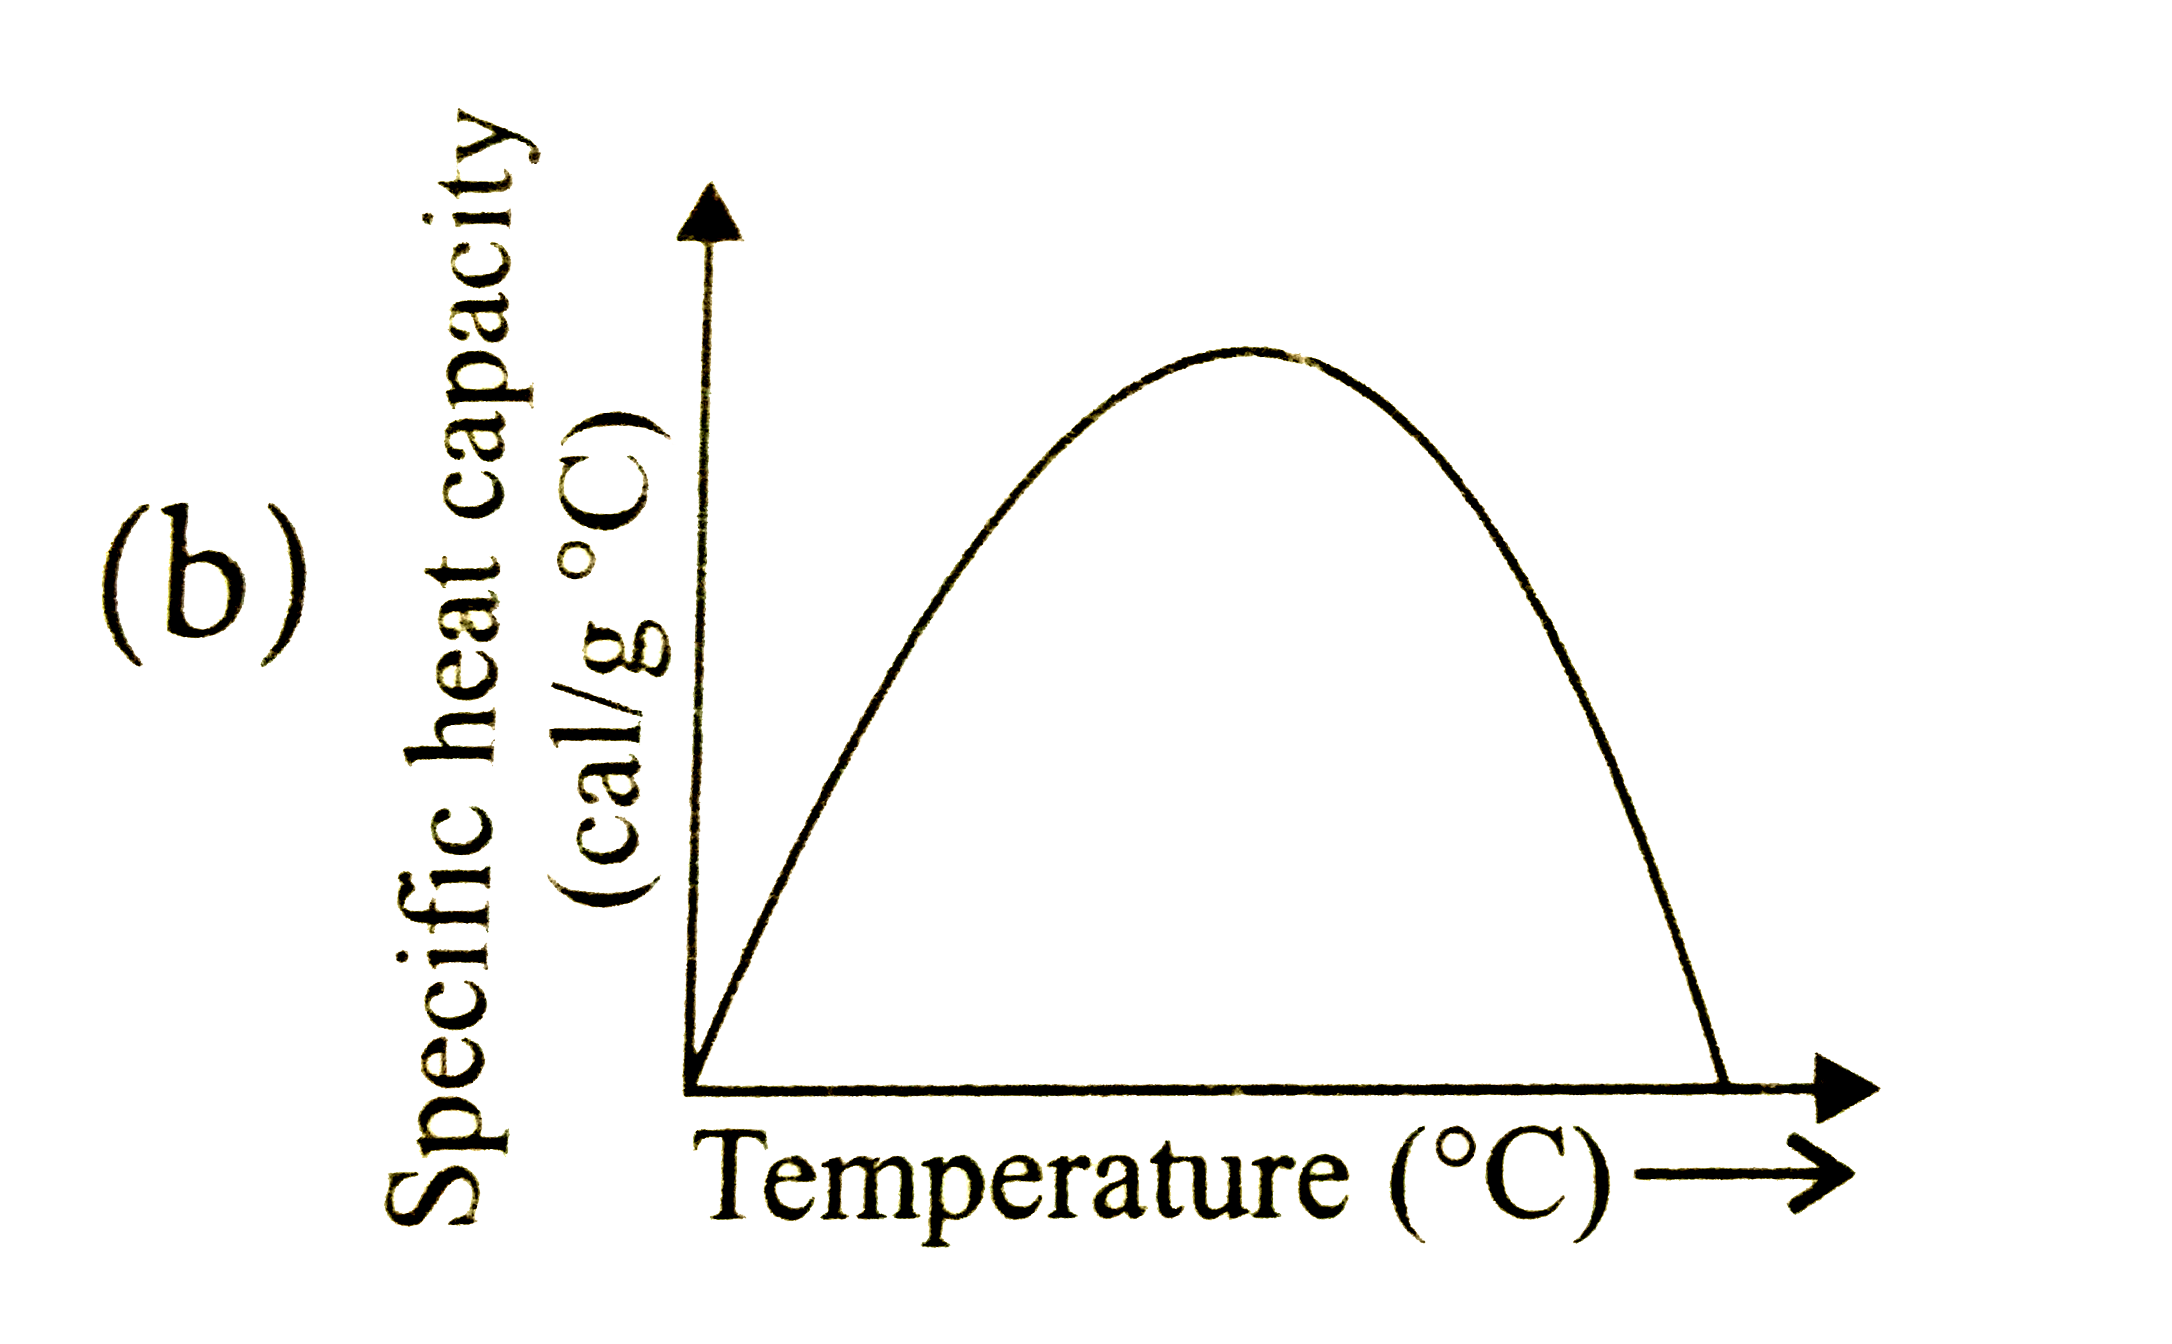 C
C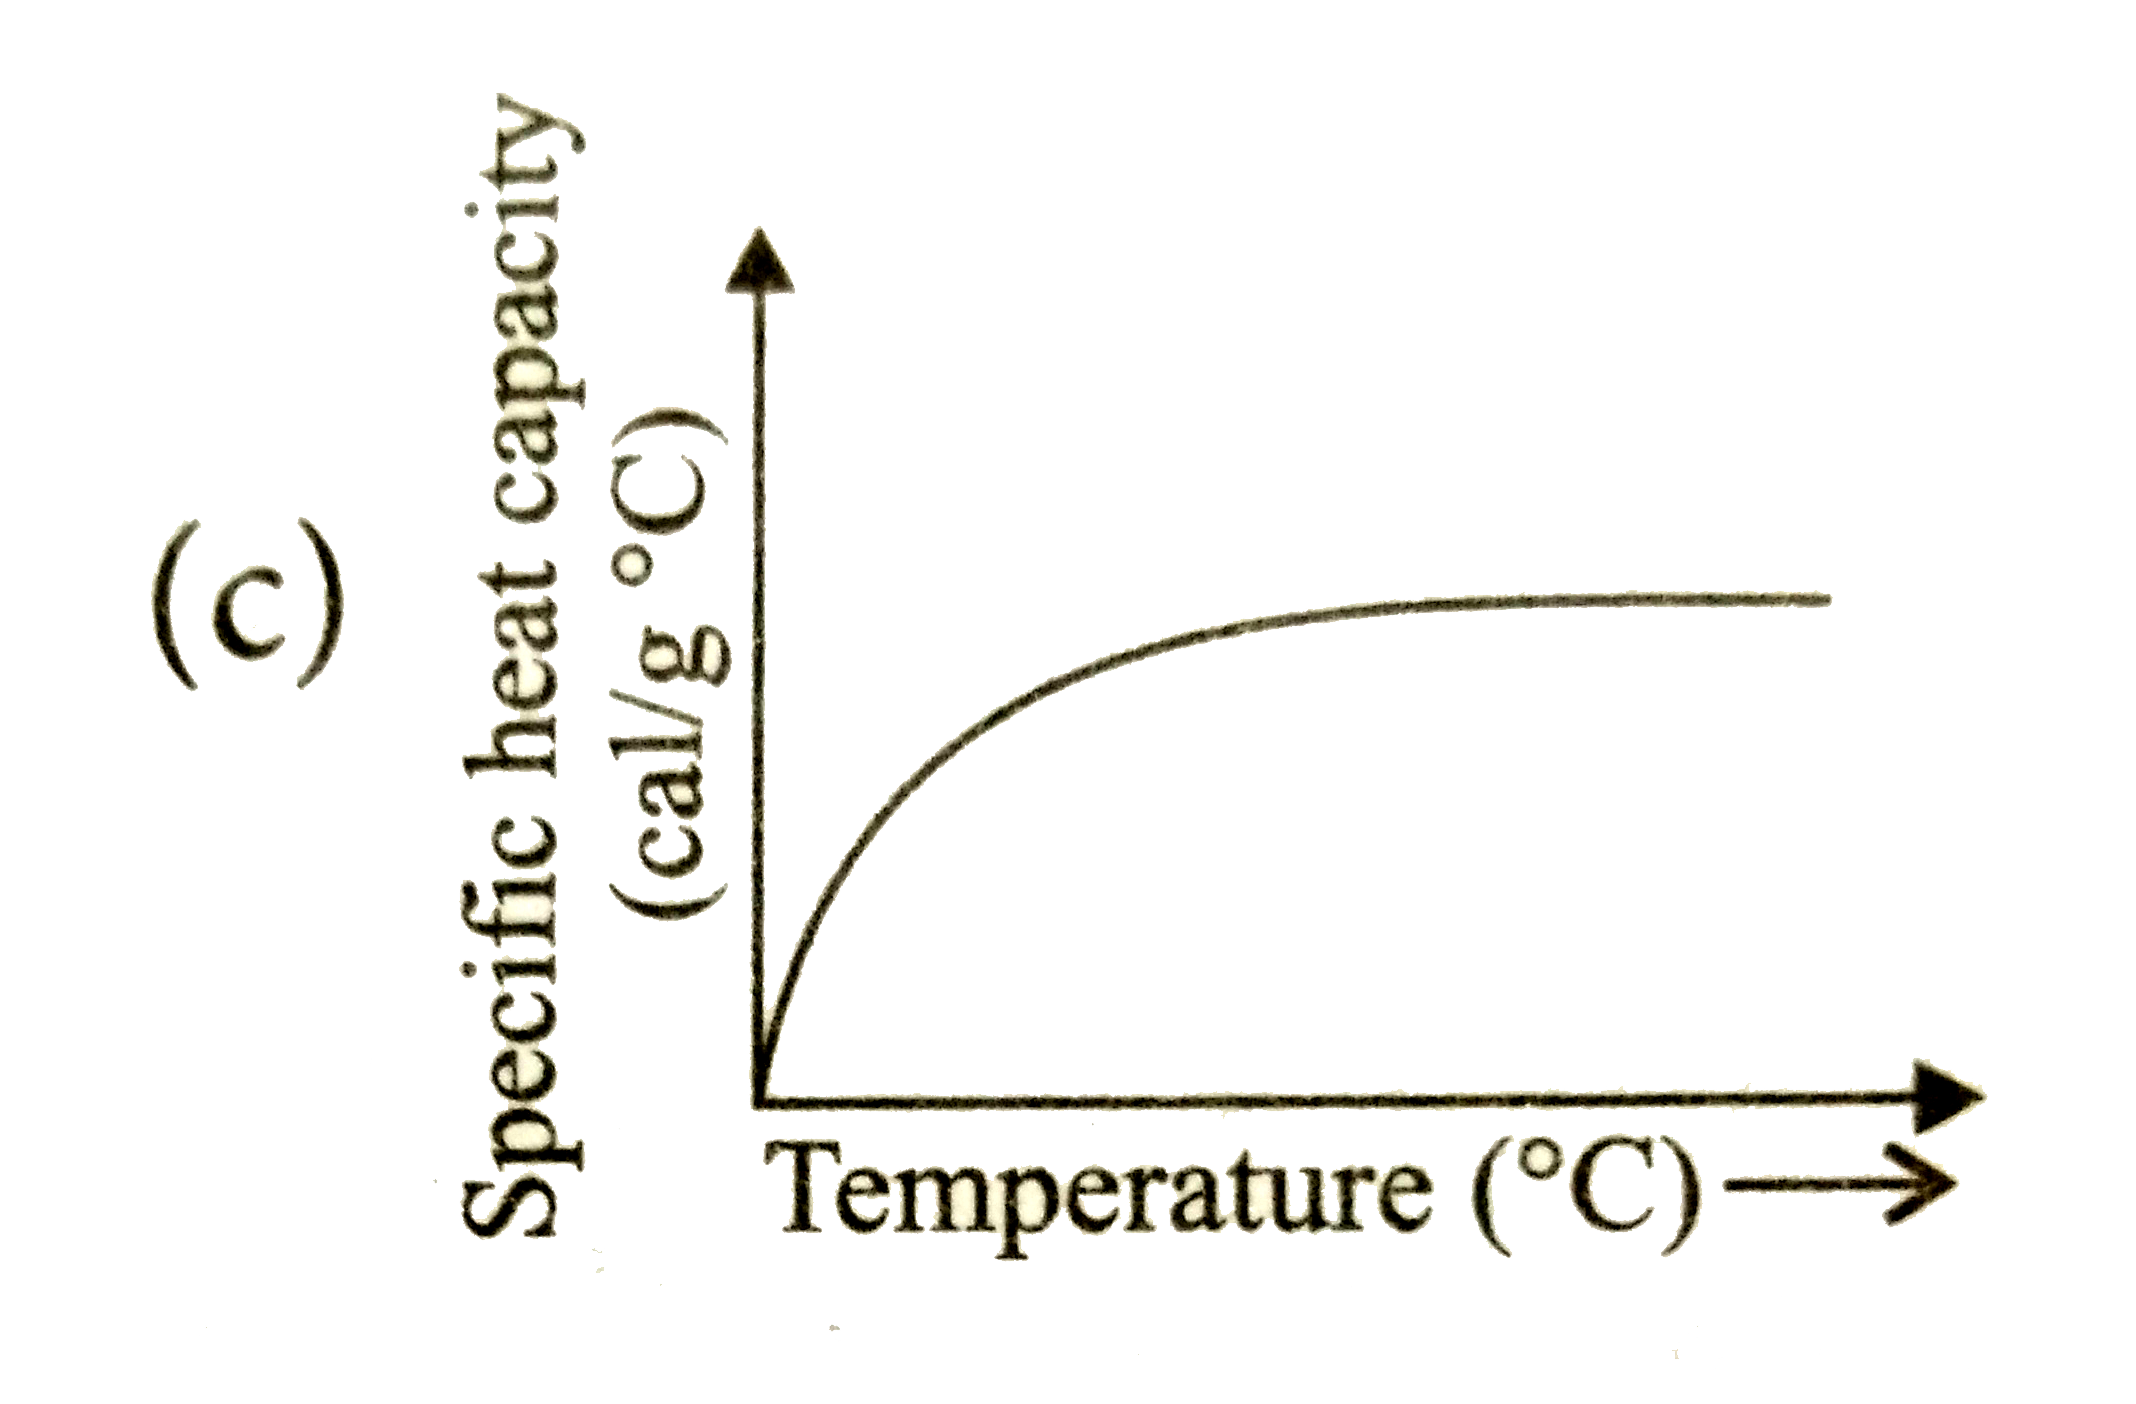 D
D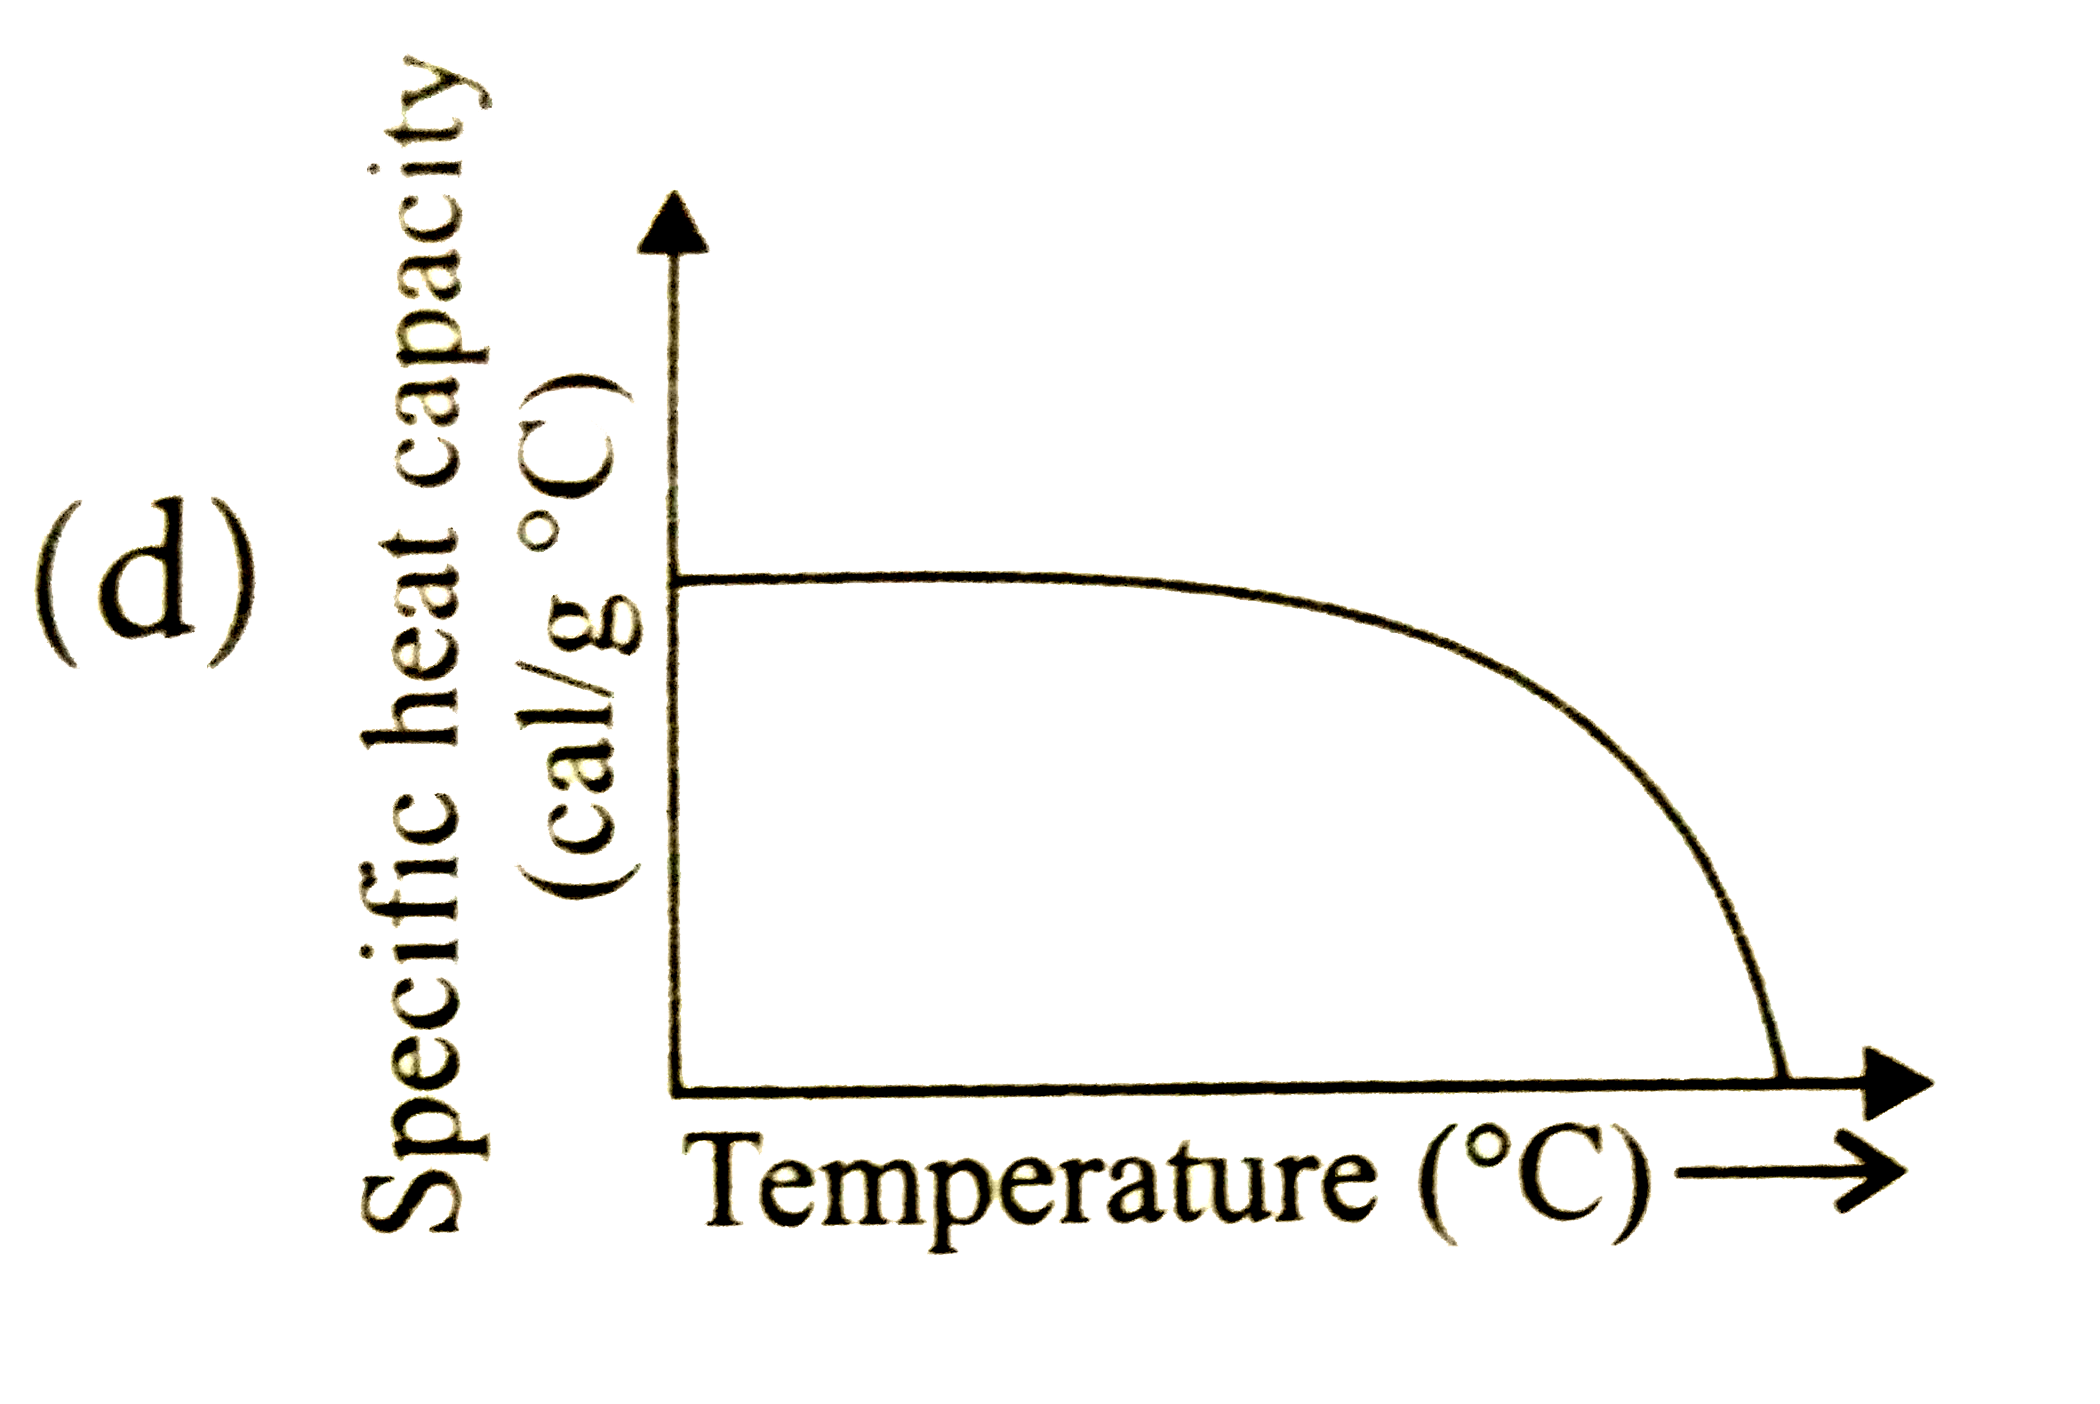
Which of the following graph is incorrect for variation of rate constant (K) with temperature for a reaction obeying Arrhenius equation ?
A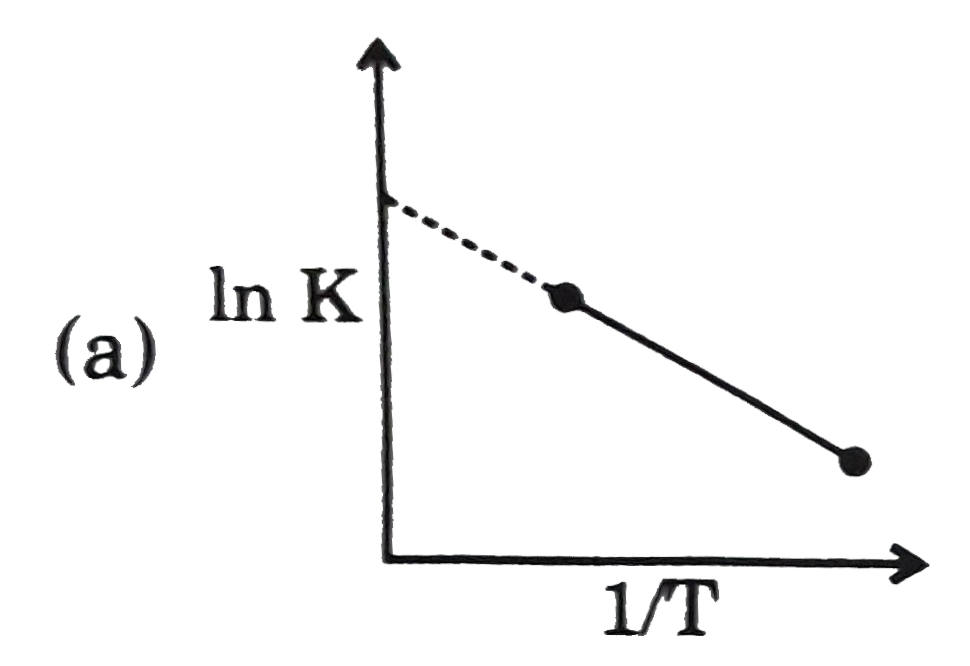 B
B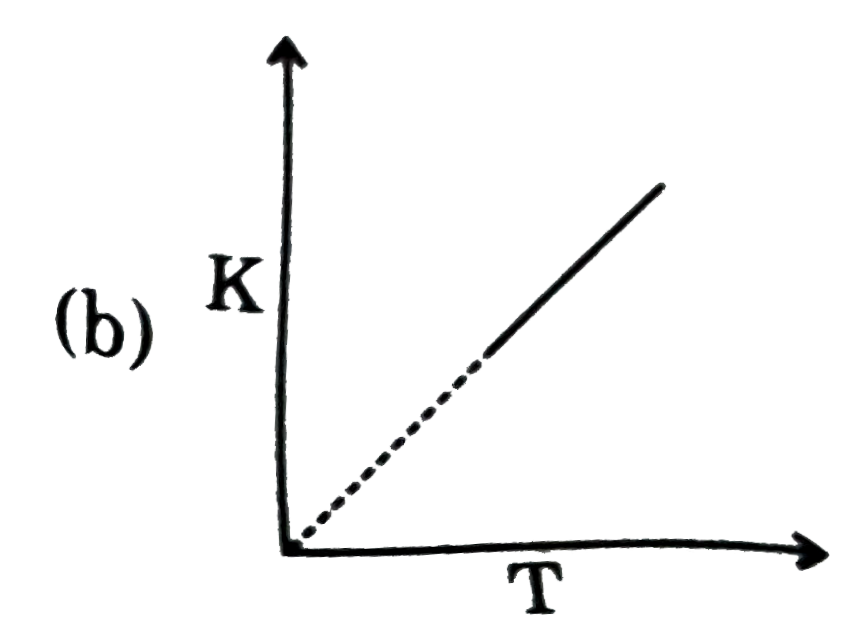 C
C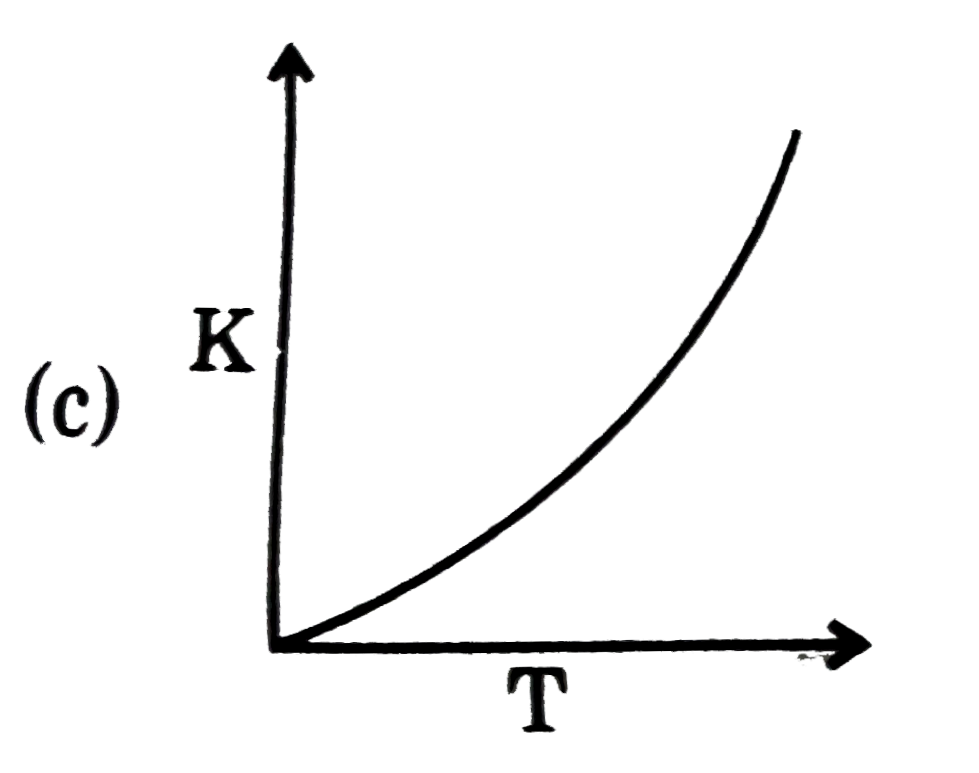 D
D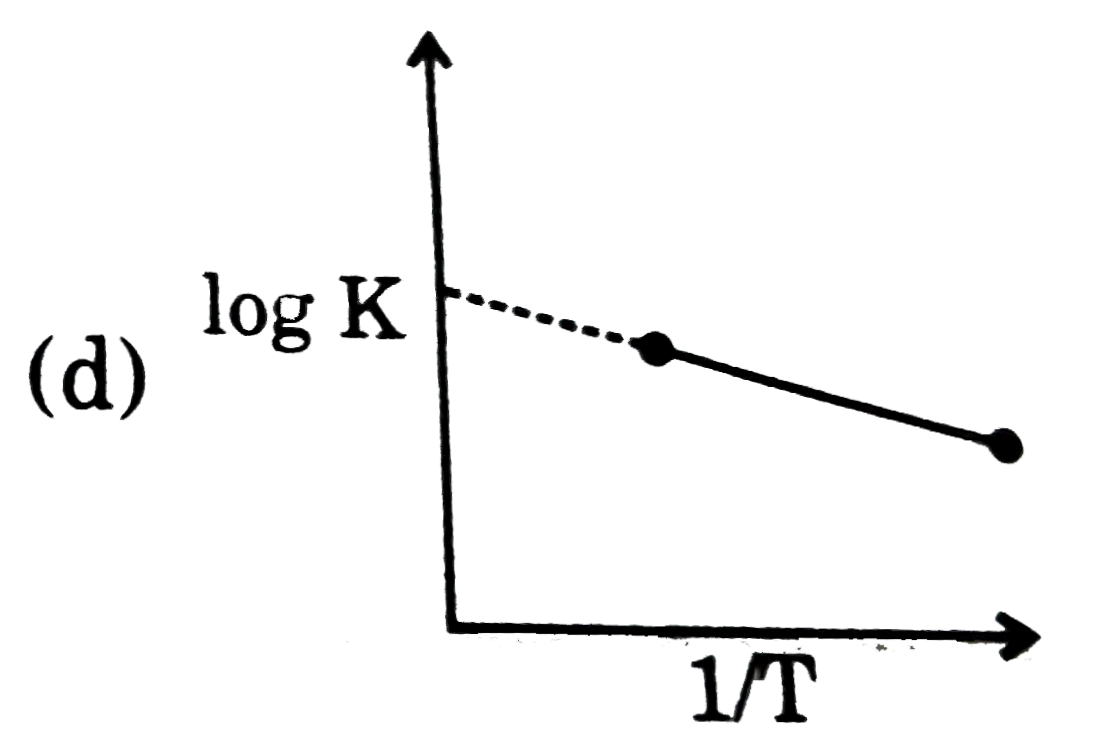
Which of the following is (are) correct for variation of rate constant with temoperature?
View SolutionWhich one of the following graphs represents the variation of surface tension of water with temperture for a small range of temperature ?
View SolutionWhich one of the following represents correctly the variations of surface tension with temperature θ ?
View SolutionWhich of the following graphs best represents the variation of acceleration 'a' with displacement x?
View SolutionWhich of the following graphs represents the variation of activity (A) of a radioactive substance with time (t).
View Solution
