In the following table, the production of various crops (in tonnes) is given from 2015 to 2019. Study the table and answer the question that follows:
दी गयी तालिका में, 2015 से 2019 तक विभिन्न फसलों का उत्पादन (टन में ) दिया गया है | इस तालिका का अध्ययन करें तथा फिर पूछे गए प्रश्न का उत्तर दीजिए |
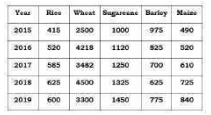 The average production of wheat (in tonnes) in the period given in the table is:
तालिका में दी गयी अवधि में गेहूँ का औसत उत्पादन ( टन में ) कितना रहा है ?
3600
3482
3300
4218
The correct Answer is:A
Step by step video, text & image solution for In the following table, the production of various crops (in tonnes) is given from 2015 to 2019. Study the table and answer the question that follows: दी गयी तालिका में, 2015 से 2019 तक विभिन्न फसलों का उत्पादन (टन में ) दिया गया है | इस तालिका का अध्ययन करें तथा फिर पूछे गए प्रश्न का उत्तर दीजिए | The average production of wheat (in tonnes) in the period given in the table is: तालिका में दी गयी अवधि में गेहूँ का औसत उत्पादन ( टन में ) कितना रहा है ? by Maths experts to help you in doubts & scoring excellent marks in Class 14 exams.
Similar Questions
In the following table, the production of various crops (in tonnes) is given from 2015 to 2019. Study the table and answer the question that follows:
दी गयी तालिका में, 2015 से 2019 तक विभिन्न फसलों का उत्पादन (टन में ) दिया गया है | इस तालिका का अध्ययन करें तथा फिर पूछे गए प्रश्न का उत्तर दीजिए |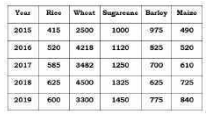 The highest growth of sugarcane production over its previous year is recorded in the year:/
किस वर्ष गन्ने का उत्पादन पिछले वर्ष की तुलना में अधिकतम रहा है ?View SolutionIn the following table, the production of various crops (in tonnes) is given from 2015 to 2019. Study the table and answer the question that follows:
दी गयी तालिका में, 2015 से 2019 तक विभिन्न फसलों का उत्पादन (टन में ) दिया गया है | इस तालिका का अध्ययन करें तथा फिर पूछे गए प्रश्न का उत्तर दीजिए |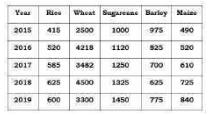 The difference (in tonnes) between the average production of barley and average production of rice is:
जौ के औसत उत्पादन तथा चावल के औसत उत्पादन के बीच क्या अंतर (टन में ) है?View Solution
Knowledge Check
- Question 1 - Select One
In the following table, the production of various crops (in tonnes) is given from 2015 to 2019. Study the table and answer the question that follows:
दी गयी तालिका में, 2015 से 2019 तक विभिन्न फसलों का उत्पादन (टन में ) दिया गया है | इस तालिका का अध्ययन करें तथा फिर पूछे गए प्रश्न का उत्तर दीजिए |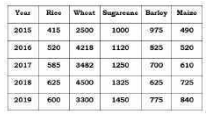 The percentage growth of maize in the year 2019 over the year 2015 is: (correct to one decimal place)
वर्ष 2019 में वर्ष 2015 की तुलना में मक्का के उत्पादन में कितने प्रतिशत की वृद्धि हुई है ? ( दशमलव के एक स्थान तक )A0.7143B0.6512C0.7777D0.6028
In the following table, the production of various crops (in tonnes) is given from 2015 to 2019. Study the table and answer the question that follows:
दी गयी तालिका में, 2015 से 2019 तक विभिन्न फसलों का उत्पादन (टन में ) दिया गया है | इस तालिका का अध्ययन करें तथा फिर पूछे गए प्रश्न का उत्तर दीजिए | The percentage growth of maize in the year 2019 over the year 2015 is: (correct to one decimal place)
वर्ष 2019 में वर्ष 2015 की तुलना में मक्का के उत्पादन में कितने प्रतिशत की वृद्धि हुई है ? ( दशमलव के एक स्थान तक )View SolutionThe following table shows the worldwide production of steel in 1920-1927. Study the table and answer the questions.
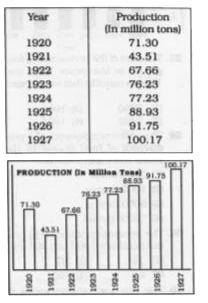
The average production of steel is (in million tonnes)View SolutionThe given table represents the production of different types of motorcycles (in thousands) over a period of six years. Study the table carefully and answer the questions that follows:
दी गयी तालिका छः वर्षों की अवधि के दौरान अलग-अलग प्रकार की मोटर साइकिलों के उत्पादन ( हज़ार में ) को दर्शाती है | इस तालिका का ध्यानपूर्वक अध्ययन करें तथा फिर पूछे गए प्रश्नों का उत्तर दीजिए | During 2015, the production of which type of motorcycle was more than 25% of the total
production of all types of motorcycles in 2017?
2015 के दौरान, किस प्रकार की मोटरसाइकिल का उत्पादन 2017 में सभी प्रकार की मोटर साइकिलों के कुल उत्पादन के 25% से अधिक रहा है?View SolutionThe given table represents the production of different types of motorcycles (in thousands) over a period of six years. Study the table carefully and answer the questions that follows:
दी गयी तालिका छः वर्षों की अवधि के दौरान अलग-अलग प्रकार की मोटर साइकिलों के उत्पादन ( हज़ार में ) को दर्शाती है | इस तालिका का ध्यानपूर्वक अध्ययन करें तथा फिर पूछे गए प्रश्नों का उत्तर दीजिए | What is the ratio of the total number of motorcycles of type B produced in 2016 and 2018 to the total number of motorcycles of type D produced in 2013, 2015 and 2016?
2016 तथा 2018 में उत्पादित की गयी B प्रकार की मोटरसाइकिलों की कुल संख्या का 2013, 2015 और 2016 में उत्पादिति D प्रकार की मोटरसाइकिलों की कुल संख्या के साथ अनुपात ज्ञात कीजिए |View SolutionThe given table represents the production of different types of motorcycles (in thousands) over a period of six years. Study the table carefully and answer the questions that follows:
दी गयी तालिका छः वर्षों की अवधि के दौरान अलग-अलग प्रकार की मोटर साइकिलों के उत्पादन ( हज़ार में ) को दर्शाती है | इस तालिका का ध्यानपूर्वक अध्ययन करें तथा फिर पूछे गए प्रश्नों का उत्तर दीजिए | By what percentage is the total production of type A motorcycles over six years, less than the total
production of all types of motorcycles in 2013 and 2016?
इन छः वर्षों में A प्रकार की मोटरसाइकिल का कुल उत्पादन 2013 तथा 2016 में सभी प्रकार की मोटर साइकिलों के कुल उत्पादन से कितना प्रतिशत कम रहा है ?View SolutionThe given table represents the production of different types of motorcycles (in thousands) over a period of six years. Study the table carefully and answer the questions that follows:
दी गयी तालिका छः वर्षों की अवधि के दौरान अलग-अलग प्रकार की मोटर साइकिलों के उत्पादन ( हज़ार में ) को दर्शाती है | इस तालिका का ध्यानपूर्वक अध्ययन करें तथा फिर पूछे गए प्रश्नों का उत्तर दीजिए | What is the percentage increase in the total production of all types of motorcycles from 2014to 2018?
2014 से 2018 तक सभी प्रकार की मोटरसाइकिल के कुल उत्पादन में कितने प्रतिशत की वृद्धि हुई है ?View SolutionThe given table shows the number (in thousands) of cars of five different models A, B, C, D and E produced during Years 2012-2017. Study the table and answer the questions that follows:
दी गयी तालिका पाँच अलग-अलग मॉडलों- A, B, C, D और E की कारों की संख्या ( हज़ार में ) दर्शाती है, जिनका उत्पादन वर्ष 2012-2017 के दौरान किया गया है | इस तालिका का अध्ययन करें और फिर पूछे गए प्रश्न का उत्तर दें |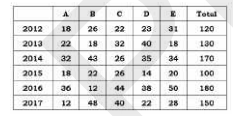 The percentage increase in the total cars in 2016 over 2012 is:
2012 की तुलना में 2016 में कुल कारों में कितने प्रतिशत की वृद्धि हुईView Solution

