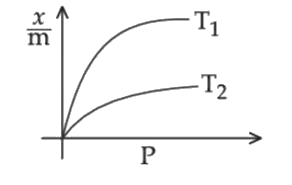
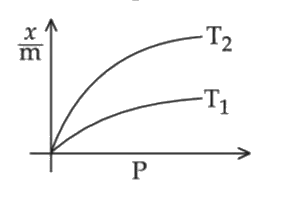
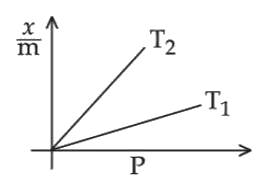
Select the graph that correctly describes the adsorption isotherms at two temperatures T1 and T2(T1>T2) for a gas : (x — mass of the gas adsorbed m-mass of adsorbent P - pressure)
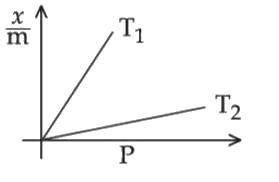
To solve the problem of selecting the correct graph that describes the adsorption isotherms at two temperatures T1 and T2 (where T1>T2), we will analyze the relationship between temperature, pressure, and the extent of adsorption.
1. Understanding Adsorption Isotherms:
- Adsorption isotherms represent the relationship between the pressure of a gas and the amount of gas adsorbed on a solid at constant temperature.
- The x-axis typically represents the pressure P, and the y-axis represents the extent of adsorption xm (where x is the mass of the gas adsorbed and m is the mass of the adsorbent).
2. Effect of Temperature on Adsorption:
- As the temperature increases, the kinetic energy of the gas molecules increases, leading to a higher tendency for the adsorbed molecules to escape back into the gas phase.
- Therefore, at a higher temperature T1, the extent of adsorption will be lower compared to a lower temperature T2.
3. Comparing the Two Temperatures:
- For T2 (lower temperature), the extent of adsorption will be higher, meaning that the curve representing T2 will lie above the curve representing T1 at the same pressure.
- Conversely, for T1 (higher temperature), the extent of adsorption will be lower, meaning that the curve representing T1 will lie below the curve representing T2.
4. Identifying the Correct Graph:
- We need to look for a graph where the curve for T2 is above the curve for T1 at all pressures.
- Among the provided options, we need to select the graph that shows this relationship correctly.
5. Conclusion:
- The correct graph will show two curves: one for T1 (lower extent of adsorption) and one for T2 (higher extent of adsorption), with the curve for T2 positioned above that of T1.
Final Answer:
- The correct option is Option 1, which shows the curve for T2 above the curve for T1.
- Adsorption isotherms represent the relationship between the pressure of a gas and the amount of gas adsorbed on a solid at constant temperature.
- The x-axis typically represents the pressure P, and the y-axis represents the extent of adsorption xm (where x is the mass of the gas adsorbed and m is the mass of the adsorbent).
- As the temperature increases, the kinetic energy of the gas molecules increases, leading to a higher tendency for the adsorbed molecules to escape back into the gas phase.
- Therefore, at a higher temperature T1, the extent of adsorption will be lower compared to a lower temperature T2.
- For T2 (lower temperature), the extent of adsorption will be higher, meaning that the curve representing T2 will lie above the curve representing T1 at the same pressure.
- Conversely, for T1 (higher temperature), the extent of adsorption will be lower, meaning that the curve representing T1 will lie below the curve representing T2.
- We need to look for a graph where the curve for T2 is above the curve for T1 at all pressures.
- Among the provided options, we need to select the graph that shows this relationship correctly.
- The correct graph will show two curves: one for T1 (lower extent of adsorption) and one for T2 (higher extent of adsorption), with the curve for T2 positioned above that of T1.
- The correct option is Option 1, which shows the curve for T2 above the curve for T1.
Topper's Solved these Questions
Similar Questions
Knowledge Check
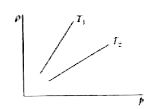
Figure shows graphs of pressure vs density for an ideal gas at two temperatures Tt and T2
AT1>T2BT1=T2CT1<T2Dany of the three is possibleShows graphs of pressure vs density for an ideal gas at two temperaturesT1andT2
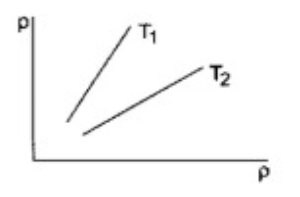 A(a)T1>T2B(b)T1=T2C(c)T1<T2D(d)Any of the three is possibe.
Figure shows graphs of pressure versus density for an ideal gas at two temperatures T1 and T2 Which is correct ?
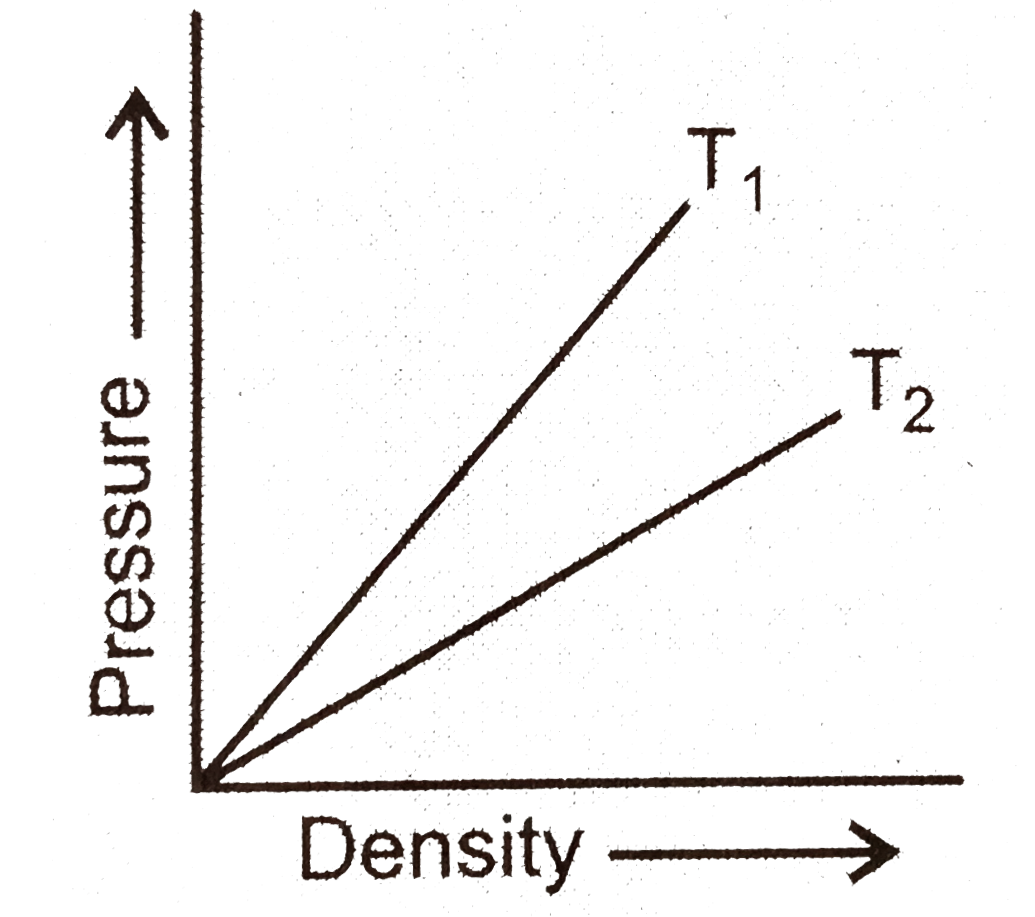 .AT1>T2BT2>T1CBothDNone of these
Figure shows graphs of pressure vs density for an ideal gas at two temperature T1 and T2 . Which of the following is correct ?
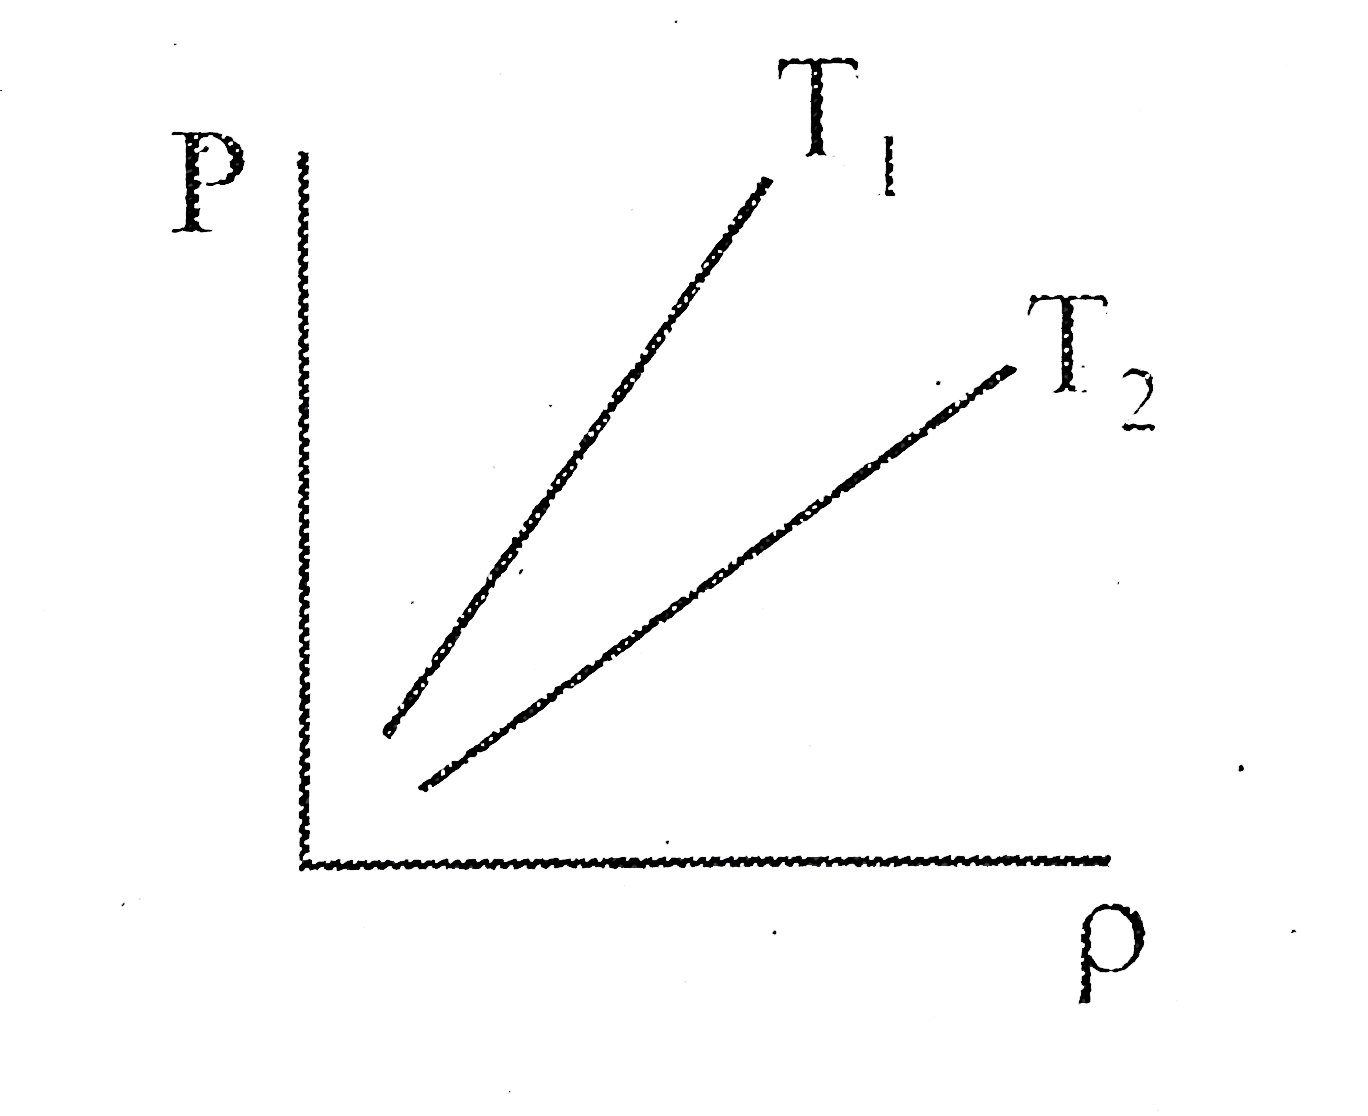
View SolutionTwo curves are given at temperatures T1andT2 in an isothermal process, then-
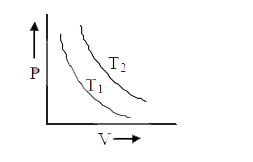
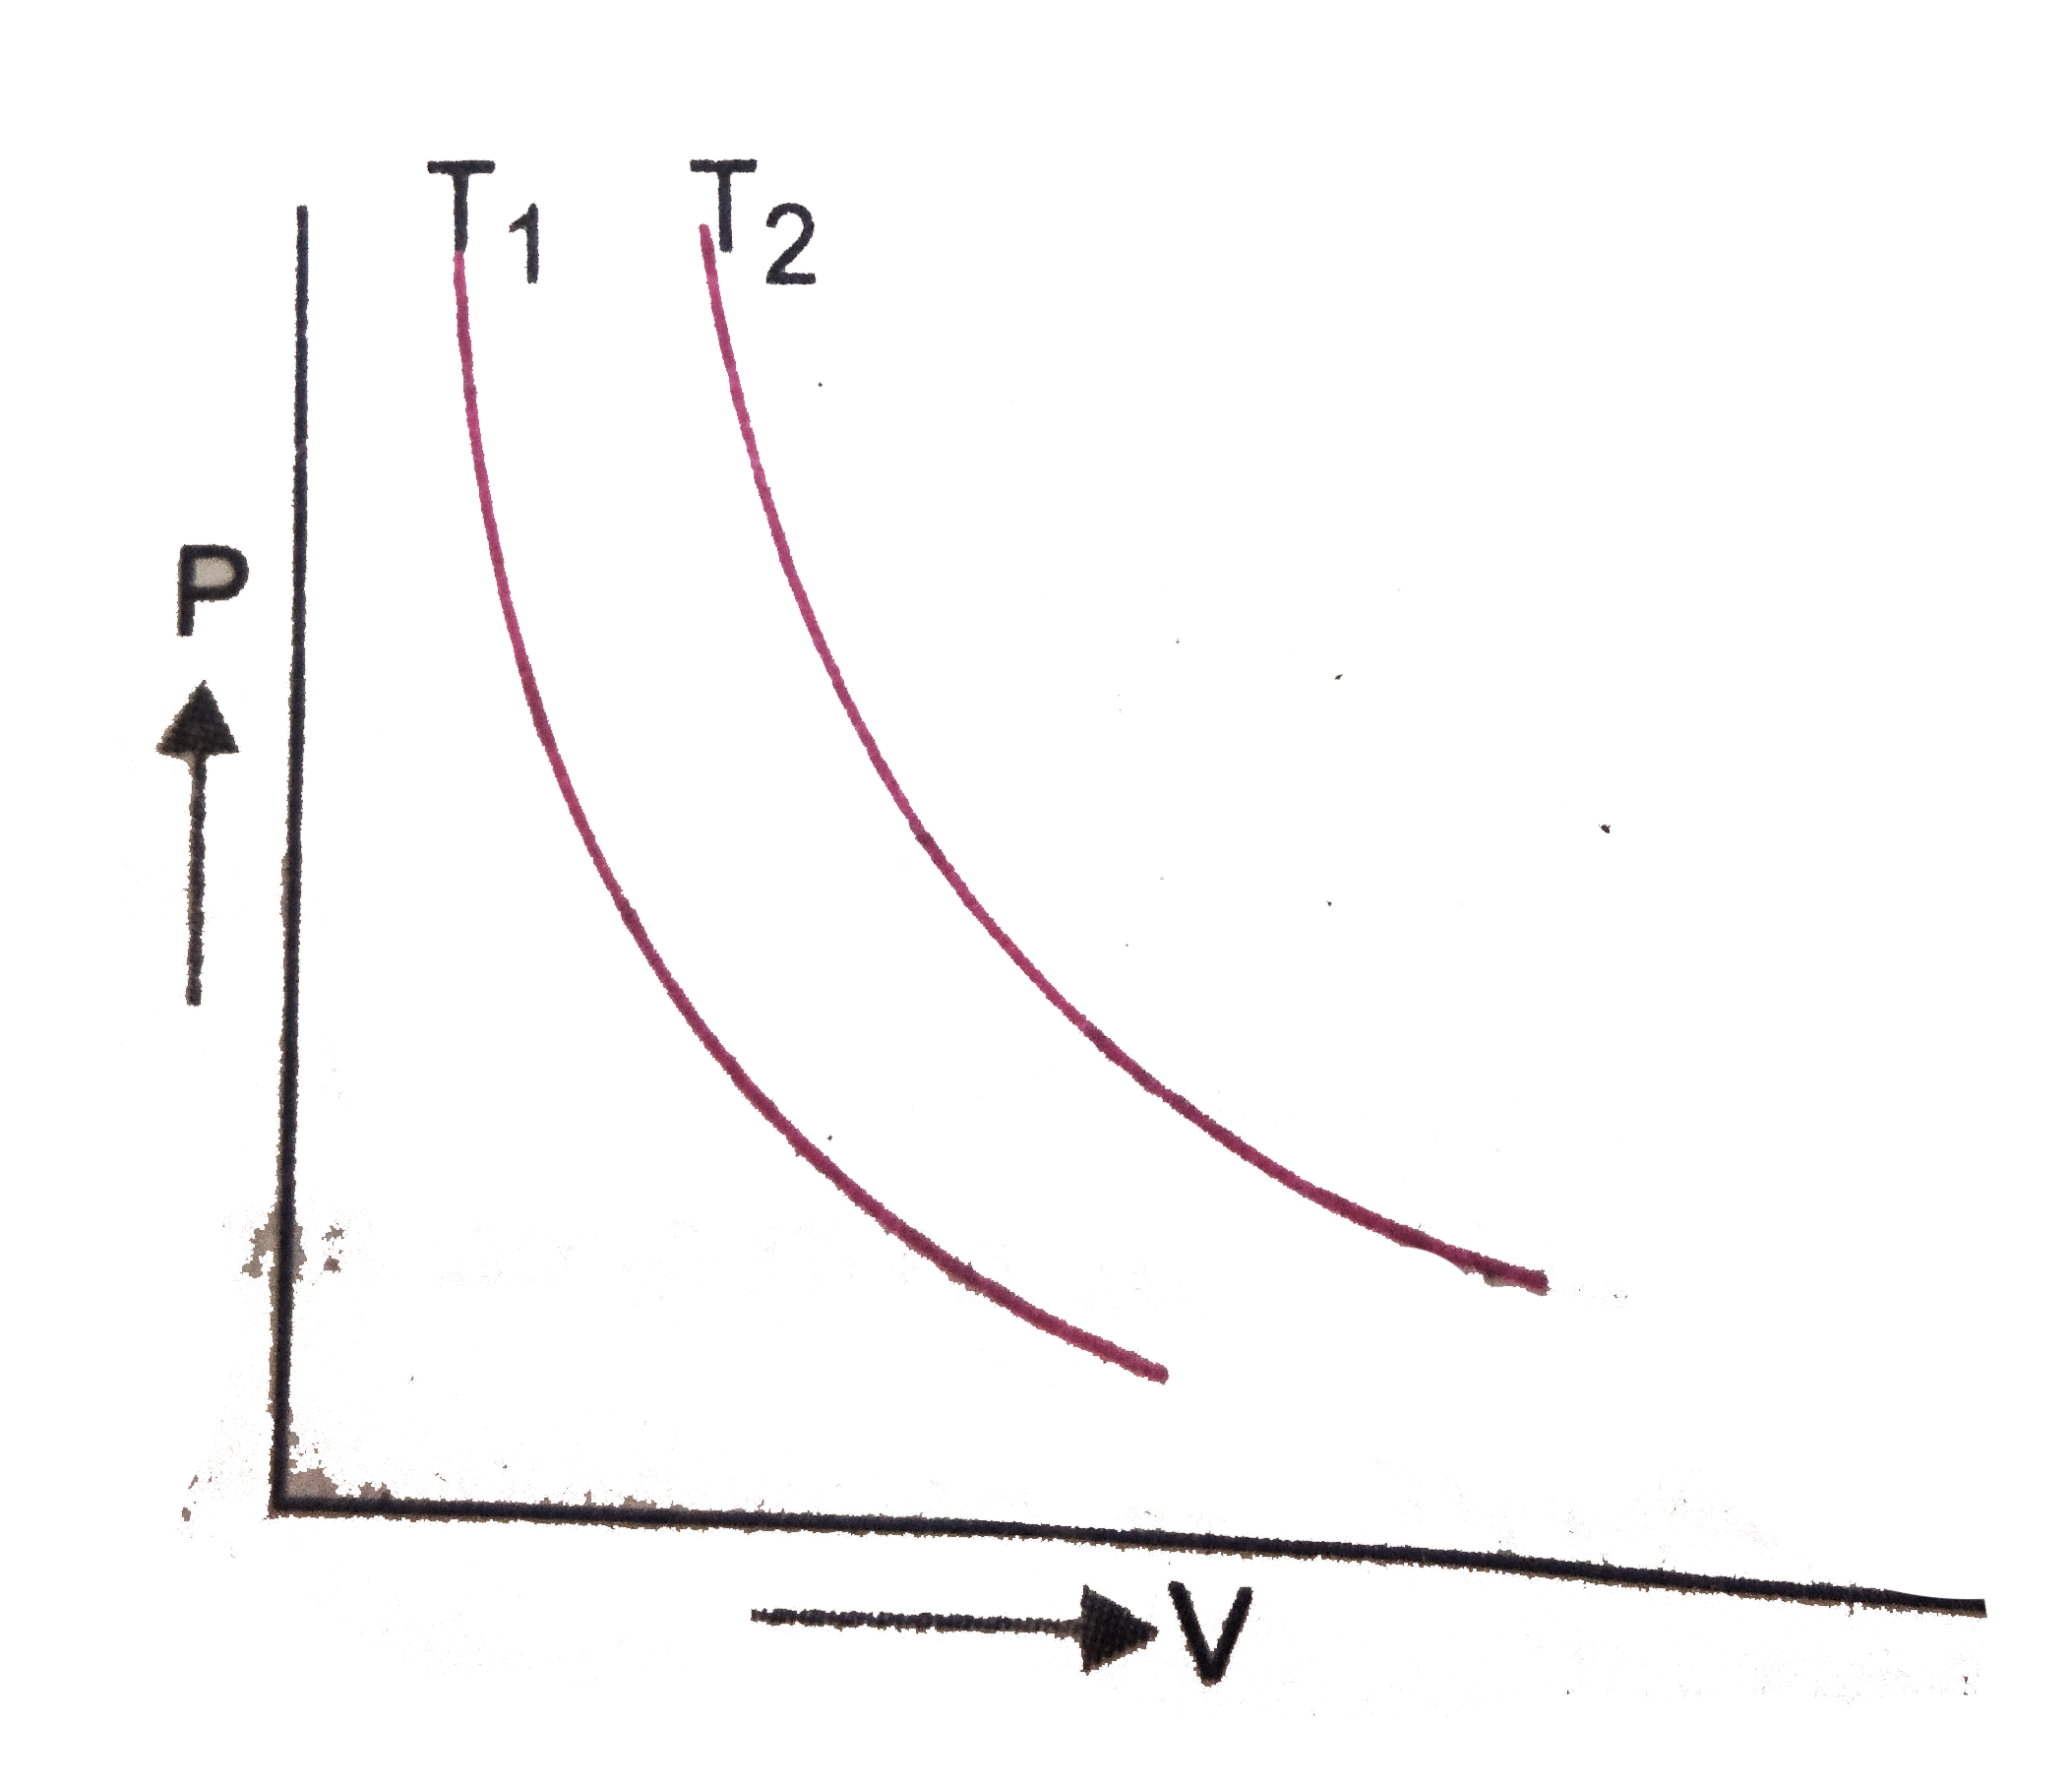
View SolutionIsothermal curves for a given mass of gas are shown at two different temperture T1andT2 in Fig. State whether T1>T2orT2>T1. Justify your answer.
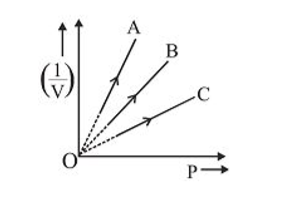
View SolutionFigure shows the isotherms of fixed mass of an ideal gas at three temperatures TA.TB and TC then:-
View SolutionFreundlich adsorption isotherm is represnted at temparetures T1,T2andT3 .
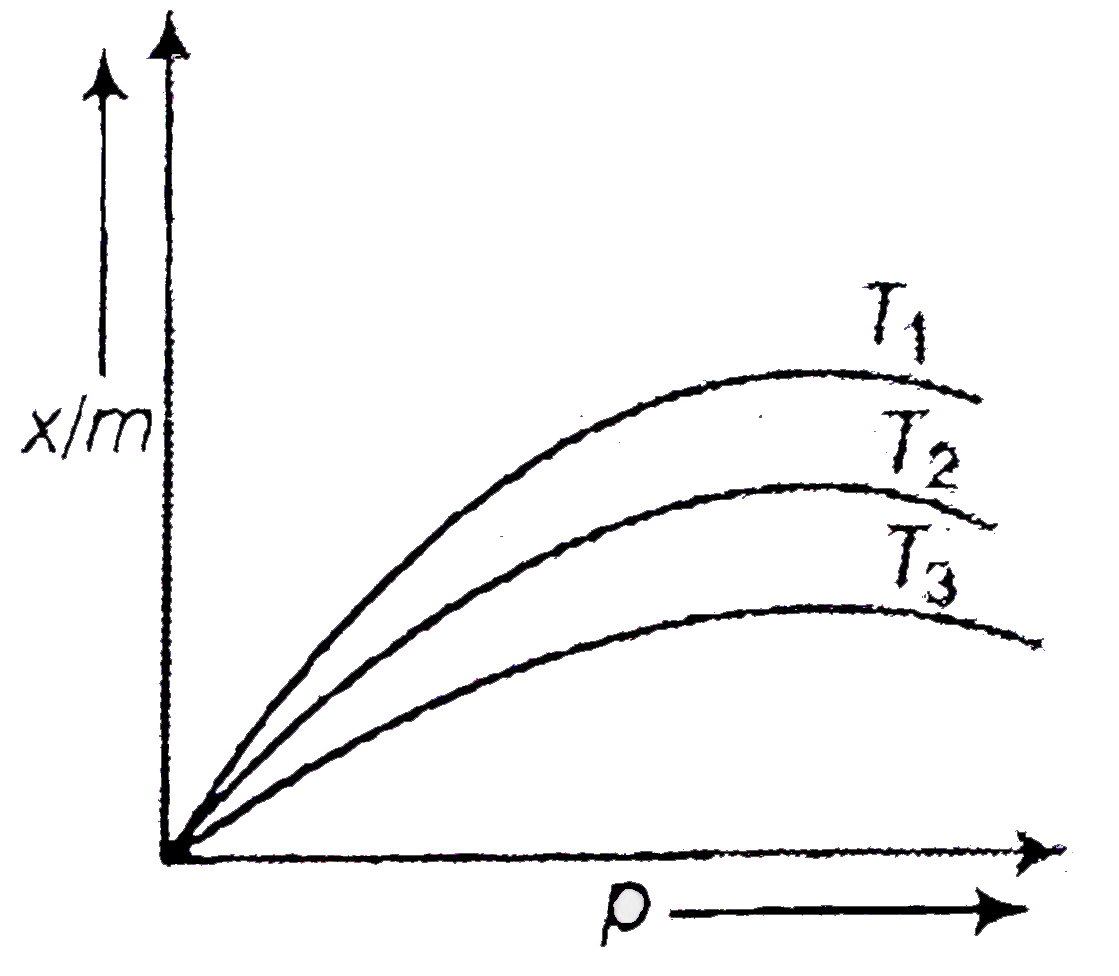
Arrange the temperatures in the increasing order as shown in the graph.
View Solution
