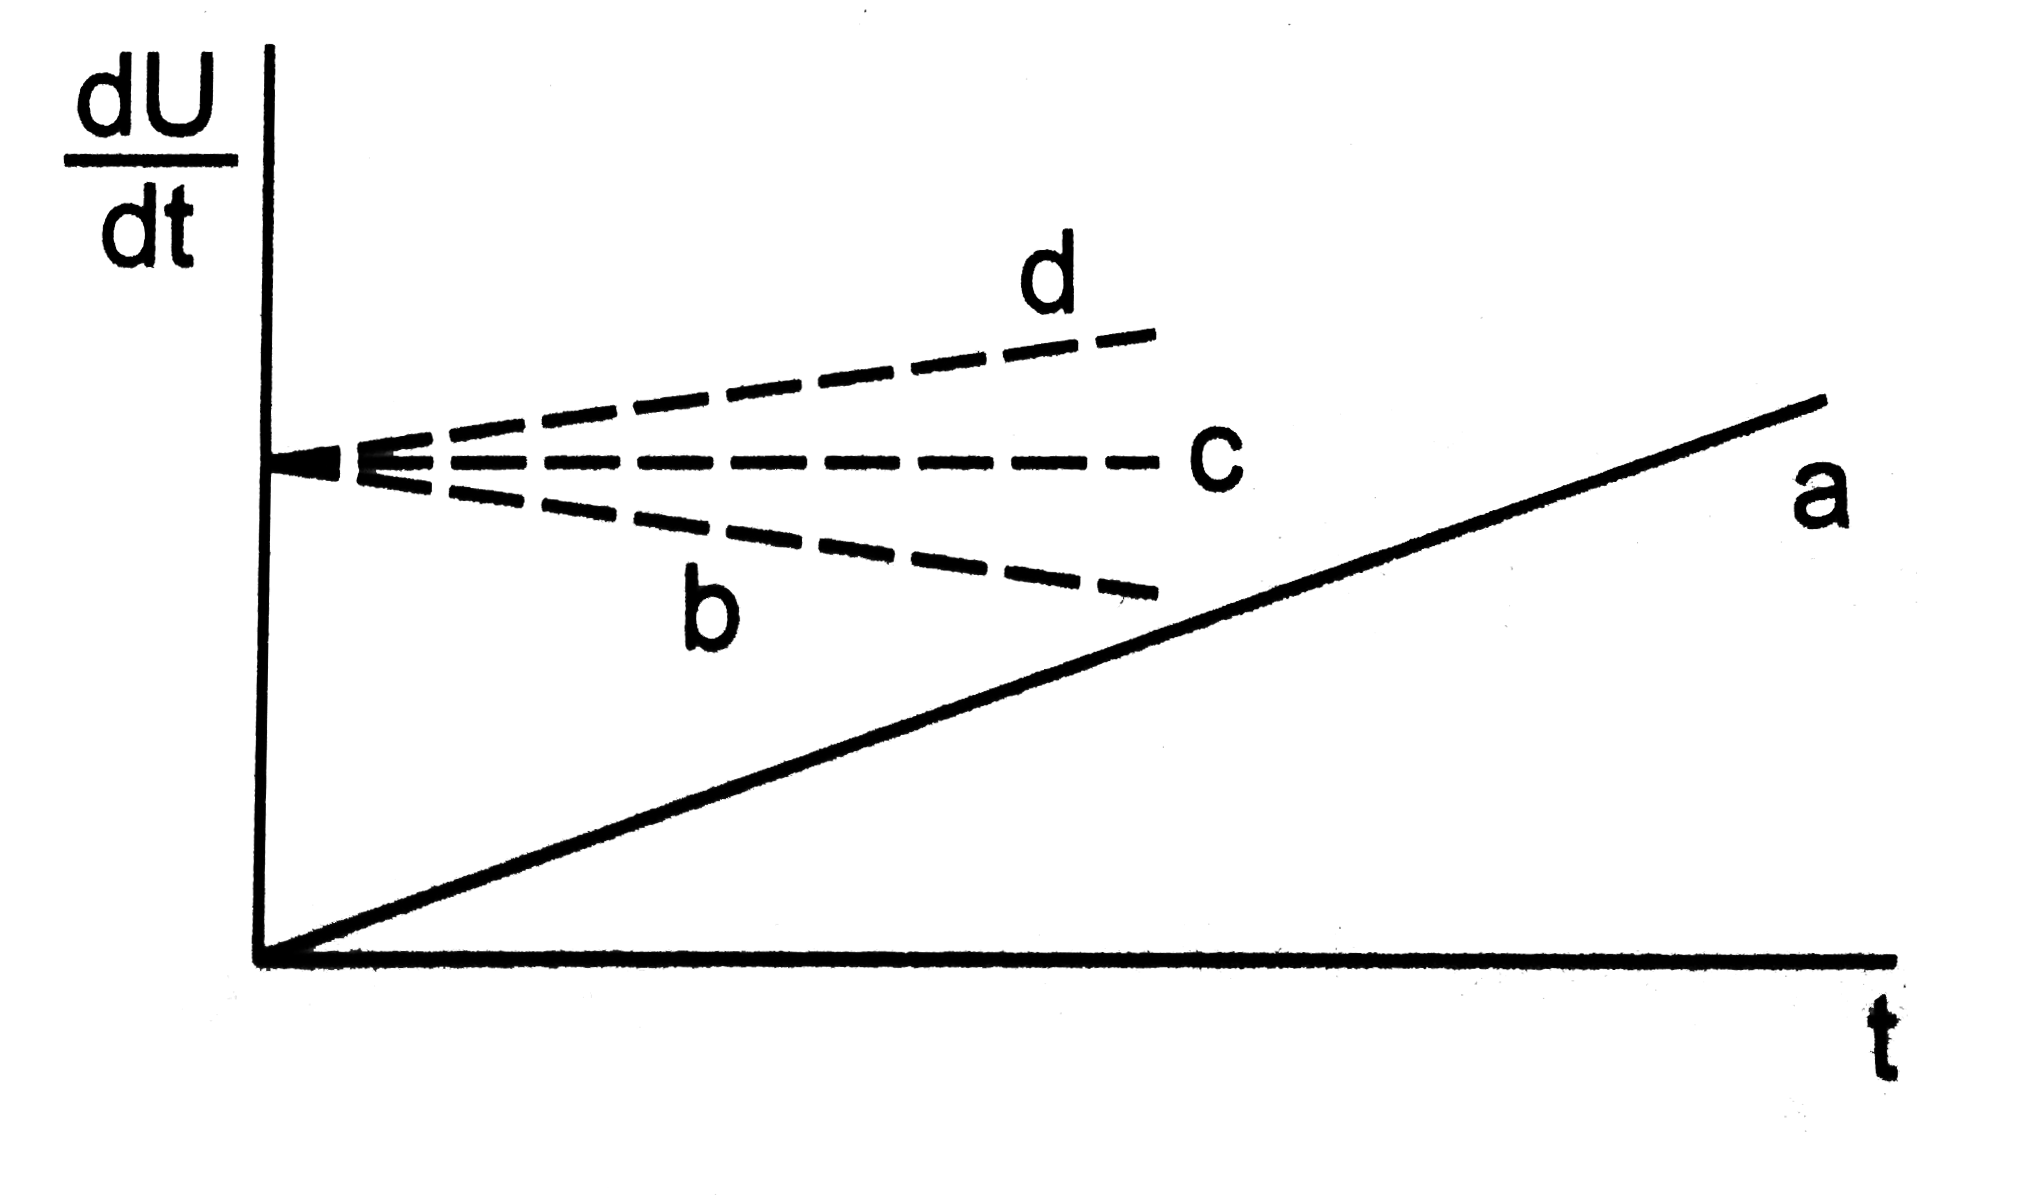
Which of the following plotes may represent the thermal energy produced in a resistor in a given time as a function of the electric current? Figure
 Solution in Tamil
The correct Answer is:A
Step by step video & image solution for Which of the following plotes may represent the thermal energy produced in a resistor in a given time as a function of the electric current? Figure by Physics experts to help you in doubts & scoring excellent marks in Class 12 exams.
Updated on:21/07/2023Topper's Solved these Questions
- THERMAL AND CHEMICAL EFFECT OF ELECTRIC CURRENTBOOK - HC VERMACHAPTER - THERMAL AND CHEMICAL EFFECT OF ELECTRIC CURRENTEXERCISE - Objective 2
5 Videos
- THERMAL AND CHEMICAL EFFECT OF ELECTRIC CURRENTBOOK - HC VERMACHAPTER - THERMAL AND CHEMICAL EFFECT OF ELECTRIC CURRENTEXERCISE - Exercise
24 Videos
- THERMAL AND CHEMICAL EFFECT OF ELECTRIC CURRENTBOOK - HC VERMACHAPTER - THERMAL AND CHEMICAL EFFECT OF ELECTRIC CURRENTEXERCISE - Short Question
9 Videos
- THE SPECIAL THEORY OF RELATIVITYBOOK - HC VERMACHAPTER - THE SPECIAL THEORY OF RELATIVITYEXERCISE - Exercise
28 Videos
- X-RaysBOOK - HC VERMACHAPTER - X-RaysEXERCISE - Exercise
27 Videos
Similar Questions
Two resistors having equal resistances are joined in series and a current is passed through the combination. Neglect any variation in resistance as the temperature changes. In a given time interval,
View SolutionAn electric current of 2.0 A passes through a wire of resistance 25Ω. How much heat will be developed in 1 minute?
View SolutionIf a constant potential difference is applied across a bulb, the current slightly decreases as time passes and then becomes constant. Explain.
View SolutionThe guru of a yogi lives in a Himalyan cave, 1000 km away from the house of the yogi . The yogi claims that whenever he thinks about his guru, the guru immediately knows about it. Calcualte the minimum possible tiem interval between the yogi thinking about the guru and the guru knowing about it.
View SolutionFind the energy, the frequency and the momentum of an X-ray photon of wavelength 0.10 nm.
View SolutionA constant current i is passed through a resistor. Taking the temperature coefficient of resistance into account, indicate which of the plots shown in Figure best represents the rate of production of thermal energy in the resistor

View SolutionA current i1=i10sinωt passes through a resistor of resistance R. How much thermal energy is produced in one time period? A current i2=−i0sinωt passes through the resistor. How much thermal energy is produced in one time period? If i1andi2 both pass through the resistor simultaneously, how much thermal energy is produced? Is the principle of superposition obeyed in this case?
View SolutionWhich of the following plots may represent the thermal energy produced in a resistor for a given current as a function of time?
View SolutionThe heat produced in a given resistor in a given time by the sinusoidal current I0 sin ωt will be the same as that by a steady current of magnitude .
View SolutionAn electric current of 4.0A flows through a 12Omega resistor. What is the rate at which heat energy is produced in the resistor?
View SolutionThe plote between concentration versus time for a zero order reaction is represented by :
View SolutionThe rms value of alternating current which when passed through a resistor produces heat energy four times that produced by directed current of 2 A through the same resistor in same time is
View Solutionभँवर धाराओं के कारण विद्युत ऊर्जा का ऊष्मीय ऊर्जा में अपव्यय होता है । सत्य/असत्य
View SolutionWhich of the following graphs correctly represents the variation of heat energy (U) produced in a metallic conductor in a given time as a function of potential difference (V) across the conductor ?
View SolutionWhat direct current will produce the same amount of thermal energy, in a particular resistor, as an alternating current that has a maximum value of 7.82 A?
View SolutionA constant current i is passed through a resistor. Taking the temperature coefficient of resistance into account, indicate which of the plots shown in Figure best represents the rate of production of thermal energy in the resistor

View Solution