The bar chart represents sales of four companies C1, C2, C3 and C4 (in millions) for the year 2012 , 2013 and 2014 Consider the bar chart and answer questions based on it .
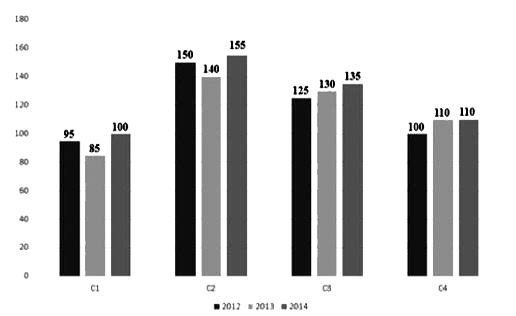
Which two companies showed increase in their sales from 2012 to 2013
A. C1, C4
B. C2, C3
C. C3, C4
D. C1, C3
B
C
A
D
The correct Answer is:B
Step by step video & image solution for The bar chart represents sales of four companies C1, C2, C3 and C4 (in millions) for the year 2012 , 2013 and 2014 Consider the bar chart and answer questions based on it . Which two companies showed increase in their sales from 2012 to 2013 A. C1, C4 B. C2, C3 C. C3, C4 D. C1, C3 by Maths experts to help you in doubts & scoring excellent marks in Class 14 exams.
Updated on:21/07/2023Similar Questions
The bar chart represents sales of four companies C1, C2, C3 and C4 (in millions) for the year 2012 , 2013 and 2014 Consider the bar chart and answer questions based on it .
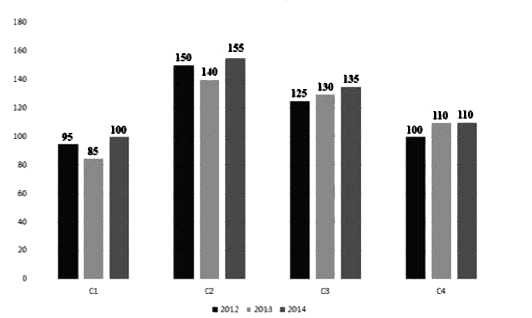
The ratio of combined sales of C1 and C4 in the year 2013 to that of year 2012 is
A. 1
B. 1/2
C. 3/2
D. 2/3
View SolutionThe bar chart represents sales of four companies C1, C2, C3 and C4 (in millions) for the year 2012 , 2013 and 2014 Consider the bar chart and answer questions based on it .
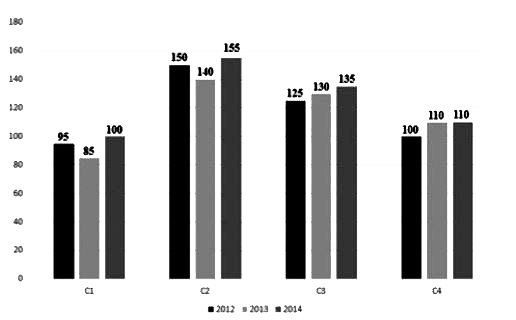
The combined sales of C2 in 2012 and 2014 is how much more than that of C3 for the same years ?
A. 12%
B. 13.75%
C. 14.75%
D. 17.30%
View Solution
Knowledge Check
Given here is a pie chart showing the cost of gold in 2010, 2011, 2012 and 2013. Study the chart and answer the following questions.
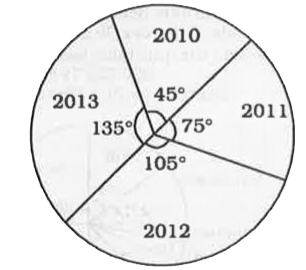
The rato of percentage increase in the price of gold from 2011 to 2012 and 2012 to 2013 isA6:5B7:5C8:5D9:5The bar chart given below shows the sales (in crores) of 2 companies A and B from years 2010 to 2015.
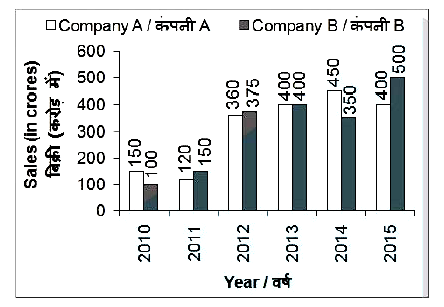
What is the percentage change in sale of company B from years 2011 to 2012?A100B225C150D125
Find the percentage increase in sales from 2012 to 2013
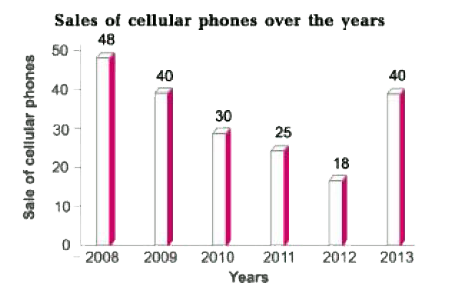
View SolutionThe given bar chart shows the sales of books in four metro branches of a company for the years 2014 and 2015.
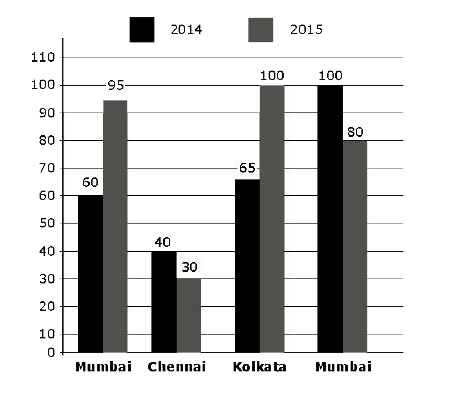
In the given bar chart, which branch has the highest increase in sale in 2015 as compared to 2014?
View SolutionThe given bar chart production of steel by companies A , B, c and D for years 2014 ,2015, 2016
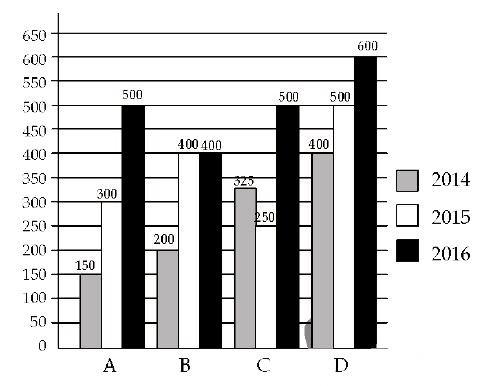
In the given bar chart which company has the maximum total production of steel
View SolutionThe given bar chart shows the sales of books in four metro branches ofa company for the years 2014 and 2015
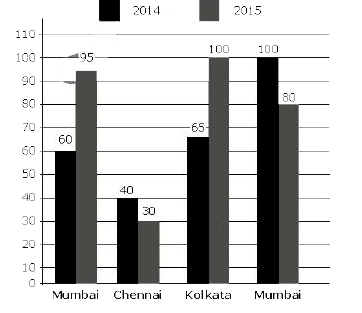
In the given bar chart the ratio the total sales between Mumbai and Delhi is
View SolutionThe given bar chart shows production of steel by companies A , B , C and D for years 2014 ,2015, 2016
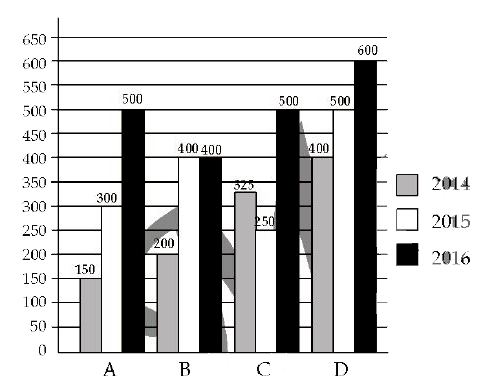
In the given pie chart, the average production of steel at C for the year 2014-2016 is:
View SolutionThe given bar chart shows production of steel by companies A, B, C and D for years 2014, 2015, 2016 (in tonnes).
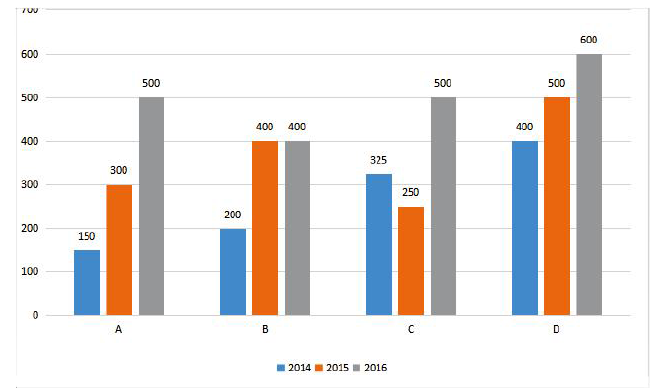
In the given bar-chart, the average production of steel at ‘C’ for the year 2014-2016 is:
View Solution
