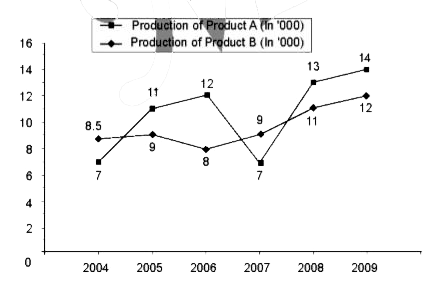
The line graph shows the production of product A and B (in thousands) during the period 2004 to 2009 and the second line Graph shows the percentage sale of these products.
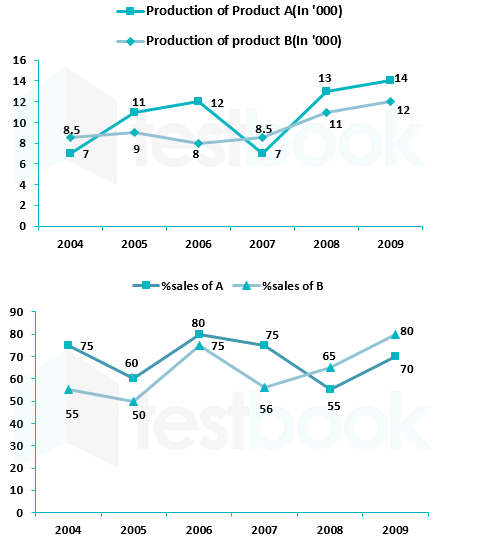
In the given line graph, what is the total sale of Products A and B in the year 2007?
13460
10010
11500
12490
The correct Answer is:B
Step by step video & image solution for The line graph shows the production of product A and B (in thousands) during the period 2004 to 2009 and the second line Graph shows the percentage sale of these products. In the given line graph, what is the total sale of Products A and B in the year 2007? by Maths experts to help you in doubts & scoring excellent marks in Class 14 exams.
Similar Questions
The line graph shows the production of product A and B (in thousands) during the period 2004 to 2009 and the second line Graph shows the percentage sale of these products.

In the given line graph, what is the total sale of Product B in the year 2004 and 2008 together?View SolutionThe line graph shows the production of product A and B (in thousands) during the period 2004 to 2009 and the second line Graph shows the percentage sale of these products.

In the given line graph. what is the total sale of Product A in the year 2005 and 2009 taken together?View Solution
Knowledge Check
- Question 1 - Select One
The given table represents the revenue (in ₹ crores) of a company from the sale of four products A,B,C and D in 6 years. Study the table carefully and answer the questions that follow.
दी गयी तालिका एक कंपनी को चार उत्पादों -A, B, C तथा D की बिक्री से 6 वर्षों में होने वाली आय ( करोड़ रुपये में ) को दर्शाती है | इस तालिका का ध्यानपूर्वक अध्ययन करें तथा फिर पूछे गए प्रश्नों का उत्तर दें The total revenue of the company from the sale of products B,C and D in 2014 is what percentage of
the total revenue from the sale of products C and D in 6 years?
2014 में उत्पाद B, C और D की बिक्री से कंपनी को हुई कुल आय 6 वर्षों में उत्पाद C और D की बिक्री से हुई कुल आय का कितना प्रतिशत है?A18B20C25D28 - Question 2 - Select One
The bar graph given below shows the production (in 000 tonnes) of rice of a country for the year 2007 to 2011 ?
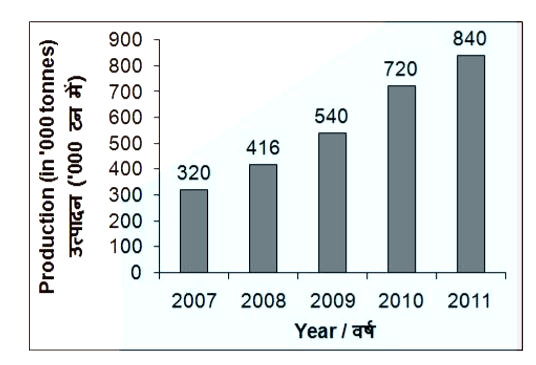
How much is the percentage increase in the production of rice in the year 2008 in comparison to year 2007 ?A25B30C35D40 - Question 3 - Select One
The bar graph given below shows the production (in000 tonnes) of rice of a country for the year 2007 to 2011 .
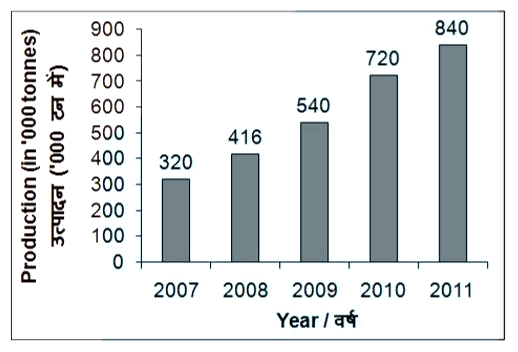
the production of rice in year 2011 is what percent of the production of rice in 2010 ?A116.66B121.5C133.33D108.5
The line graph shows the production of product A and B during the period 2004 to 2009 and the second line graph shows the percentage sale of these products
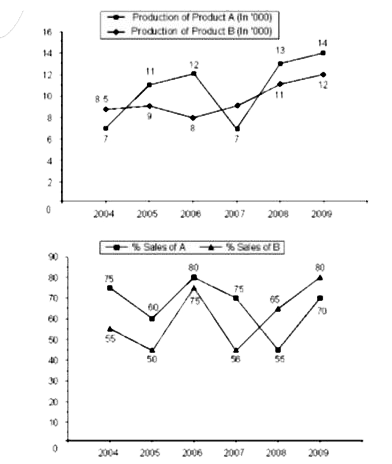
In the given line graph, what is the total sale of products A and B in the year 2007View SolutionThe line graph shows the production of product A and B during the period 2004 to 2009 and the second line graph shows the percentage sale of these products
 br>
br> 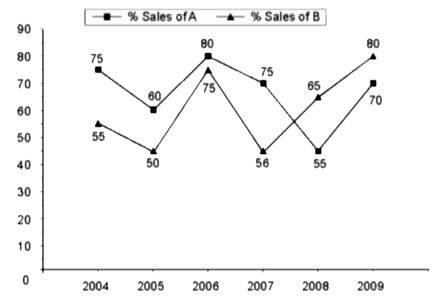
In the given line graph, what is the total sale of products A in the year 2005 and 2009 taken together?View SolutionThe line graph shows the production of product A and B (in thousands) during the period 2004 to 2009 and the second line Graph shows the percentage sale of these products.
यह पंक्ति आलेख 2004 से 2009 की अवधि के दौरान वस्तु A एवं B के उत्पादन ( हज़ार में ) को दर्शाता है तथा दूसरा पंक्ति आलेख इन वस्तुओं की प्रतिशत बिक्री को दर्शाता है |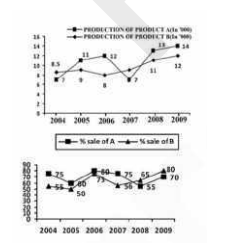 In the given line graph, what is the total sale of Product B in the year 2004 and 2008 together?
दिए गए पंक्ति आलेख के अनुसार, वर्ष 2004 एवं 2008 को मिलाकर वस्तु B की कुल बिक्री ज्ञात करें |View SolutionThe line graph shows the production of product A and B (in thousands) during the period 2004 to 2009 and the second line Graph shows the percentage sale of these products.
यह पंक्ति आलेख 2004 से 2009 की अवधि के दौरान वस्तु A एवं B के उत्पादन ( हज़ार में ) को दर्शाता है तथा दूसरा पंक्ति आलेख इन वस्तुओं की प्रतिशत बिक्री को दर्शाता है |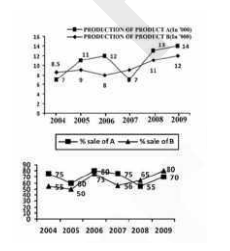 In the given line graph, what is the total sale of Product A in the year 2005 and 2009 taken together?
दिए गए पंक्ति आलेख के अनुसार, वर्ष 2005 तथा 2009 को मिलाकर वस्तु A की कुल बिक्री कितनी है ?View SolutionReading of line graphs containing the production and sales of a company in a period
View Solution
