Reading of line graphs containing the production and sales of a company in a period
Step by step video & image solution for Reading of line graphs containing the production and sales of a company in a period by Maths experts to help you in doubts & scoring excellent marks in Class 14 exams.
Updated on:21/07/2023Similar Questions
Knowledge Check
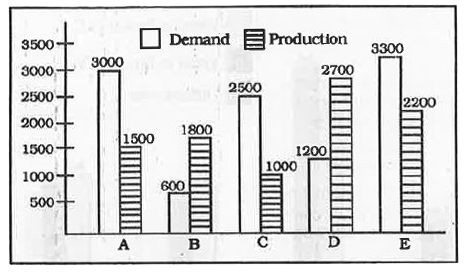
The following chart represents Demand and Production for 5 companies ABCDE. On the basis of the graph answer the questions.

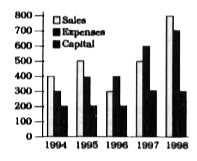
If the production of company D is h times of the production of company A. Then h equals :A1.5B2.5C1.2D1.8The following graph gives Sales, Expenses and Capital of a company for a period of five years 1994 to 1998. Read the graph and answer the following questions.

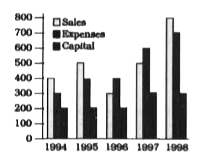
In which year was the Sales to Expense ratio the lowest?A1994B1996C1997D1998The following graph gives Sales, Expenses and Capital of a company for a period of five years 1994 to 1998. Read the graph and answer the following questions.

What was the average per annum increase in sales (in Rs cr.) from 1994 to 1998 ?A50B60C80D100
Reading of line graphs containing the no of girls in a three different school in a given period
View SolutionReading of line graphs containing the no of students appearing from various towns
View SolutionReading the graph of production of paper by three company in different years
View SolutionReading the bar graph containing the average exports for a given period
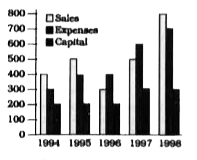
View SolutionThe following graph gives Sales, Expenses and Capital of a company for a period of five years 1994 to 1998. Read the graph and answer the following questions.

In which years was the ratio of sales tom capital the lowest ?
View Solution
