The bar chart given below shows the ratio of expenditure to revenue for seven consecutive years Y1, Y2, Y3, Y4, Y5, Y6 and Y7.
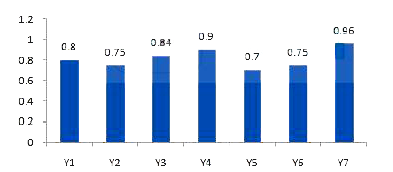
Revenue for years Y4 is Rs 22500. What is the profit for year Y4?
Rs2750
Rs2250
cannot be determined
Rs2500
The correct Answer is:B
Step by step video, text & image solution for The bar chart given below shows the ratio of expenditure to revenue for seven consecutive years Y1, Y2, Y3, Y4, Y5, Y6 and Y7. Revenue for years Y4 is Rs 22500. What is the profit for year Y4? by Maths experts to help you in doubts & scoring excellent marks in Class 14 exams.
Updated on:21/07/2023Similar Questions
The bar chart given below shows the ratio of expenditure to revenue for seven consecutive years Y1, Y2, Y3, Y4, Y5, Y6 and Y7.
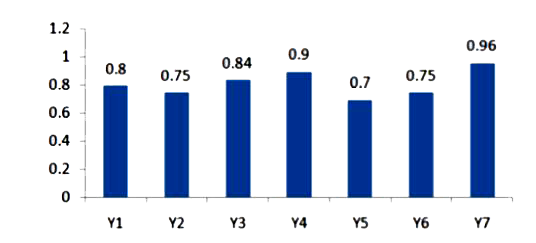
The profit percentage is lowest for which year?
View SolutionThe line chart given below show the ratio of imports to exports for a country for 5 consecutive years Y1, Y2, Y3, Y4 and Y5.
If the exports for year Y3 is Rs.35000 crore, then what will be imports (in crores) for the year Y3?
View Solution
Knowledge Check
The bar chart given below shows the total exports (in =1000 crores of a country for 7 consecutive years Y1,Y2,Y3,Y4,Y5,Y6 and Y7.
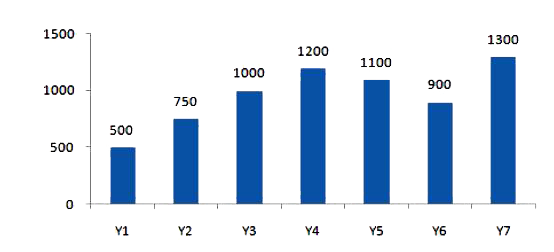
What is the average exports from years Y1 to Y7?AA) 931.45BB) 886.19CC) 964.28DD) 847.87The bar charg given below shows the total exports (in =1000 crores) of a country for 7 consecutive years Y1,Y2,Y3,Y4,Y5,Y6 and Y7.
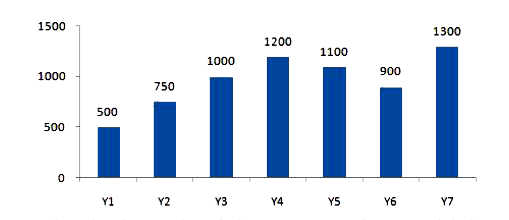
What is the ratio of the exports of year with lowest exports and the year with second highest exports?A9:12B5:12C9:13D5:11The table given below shows the production of rice and the area under rice cultivation of a country for 5 consecutive years Y1, Y2, Y3, Y4 and Y5.
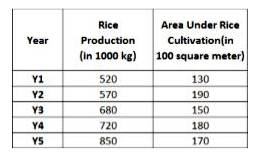
What is the yield per square meter for the year Y3?A37.66 kgB63.33 kgC45.33 kgD52.50 kg
The table given below shows the production of rice and the area under rice cultivation of a country for 5 consecutive years Y1, Y2, Y3, Y4 and Y5.
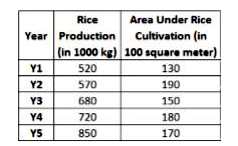
what is the percentage change in the yield per square meter of Y5 as compared to Y1?
View SolutionThe table given below shows the production of rice and the area under rice cultivation of a country for 5 consecutive years Y1, Y2, Y3, Y4 and Y5.
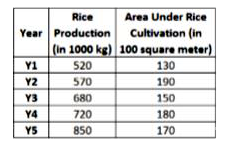
What is the per year average production of rice ?
View SolutionThe bar chart given below shows the number of flights from by Air India in 6 consecutive years .
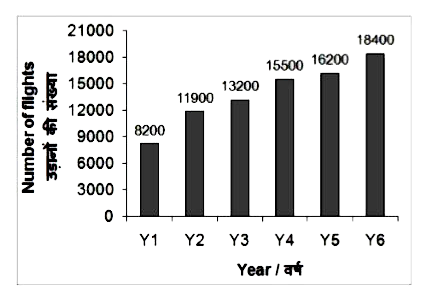
Number of flights of Y2 are what percent of number of flights of Y5?
View SolutionThe bar chart given below shows the number of flights from by Air India in 6 consecutive years .
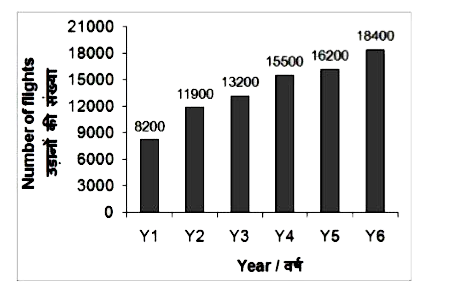
Number flights in Y6 are how much percent more than number of flights in Y1?
View SolutionThe bar chart given below shows the revenue (in crores) of company A for the years 2008 to 2015.
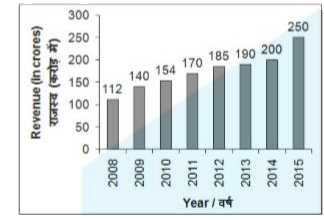
What is the percentage increase in revenue in the year 2010 in comparison to the previous year?
View Solution
